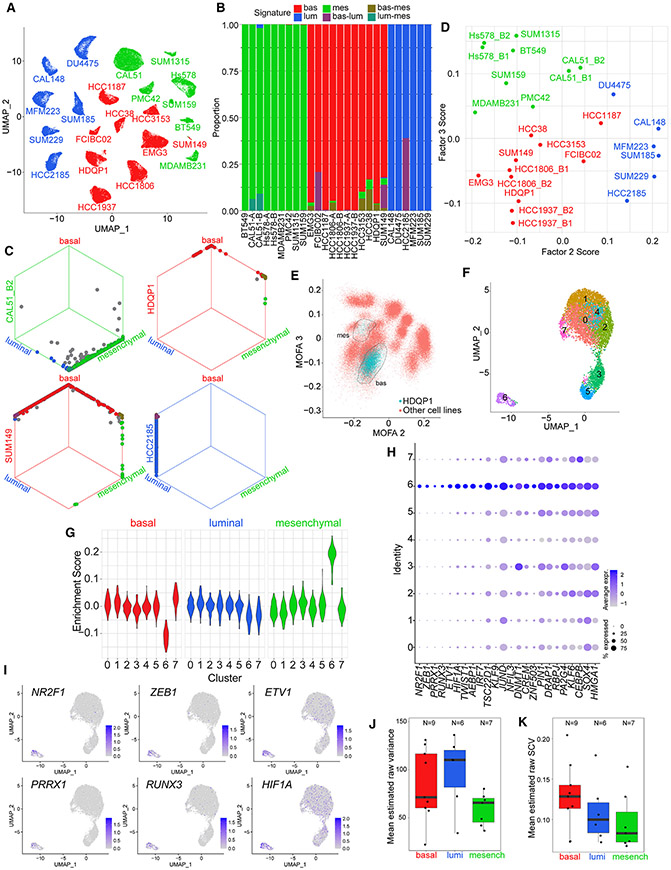
Figure 4. Intra-tumor heterogeneity assessment by single-cell analyses.
(A) UMAP visualization of scRNA-seq gene expression data from TNBC cell lines. Single cells from each cell line are colored according to assigned subtype from bulk RNA-seq.
(B) Bar plot showing significantly enriched TNBC transcriptional subtype signatures (bootstrap p <0.05) in single cells from samples belonging to each TNBC subtype.
(C) Hexagonal plots showing significantly enriched TNBC transcriptional subtype signatures for all analyzed single cells from four cell line samples. Each point represents a single cell. Cells are positioned along each axis according to bootstrap classification score (1 minus bootstrap p value) for the indicated cell identity. Cells significantly enriched for each signature are shown along the corresponding edges of the plot. Cell colors represent significantly enriched signatures; cells with no significant enrichments are shown in gray.
(D) Average MOFA F2 and F3 scores of single cells from each sample.
(E) Inferred MOFA F2 and MOFA F3 scores for HDQP1 single cells (blue) and all other single cells (red). Circled regions show two apparent HDQP1 subclusters.
(F) UMAP visualization of HDQP1 cell line scRNA-seq data.
(G) Enrichment scores of TNBC subtype signatures in single cells of HDQP1 by cluster. Scores measure the difference in TNBC subtype signature expression compared with average expression across HDQP1 cells after correcting for the differences observed for random size-match signatures.
(H) Cluster-specific expression of TFs differentially expressed in HDQP1 cluster 6.
(I) UMAP visualization of HDQP1 single cells, colored by expression of the six mostly strongly overexpressed TFs in cluster 6.
(J) Boxplot showing mean estimated raw variance across highly expressed genes in single-cell samples assigned to each subtype. For cell lines with two replicate samples, only the higher-depth replicate is shown. Bottom and top hinges of inset box plots show the 25th and 75th percentiles. Upper whiskers extend from the upper hinge to the highest value that is no further than 1.5 times the interquartile range (IQR) from the hinge. Lower whiskers extend from the lower hinge to the lowest value no further than 1.5 times the IQR from the hinge.
(K) Boxplot showing mean estimated raw SCV across highly expressed genes in single-cell samples assigned to each subtype. For cell lines with two replicate samples, only the higher-depth replicate is shown. Bottom and top hinges of inset box plots show the 25th and 75th percentiles. Upper whiskers extend from the upper hinge to the highest value that is no further than 1.5 times the interquartile range (IQR) from the hinge. Lower whiskers extend from the lower hinge to the lowest value no further than 1.5 times the IQR from the hinge.
See also Figure S3.

