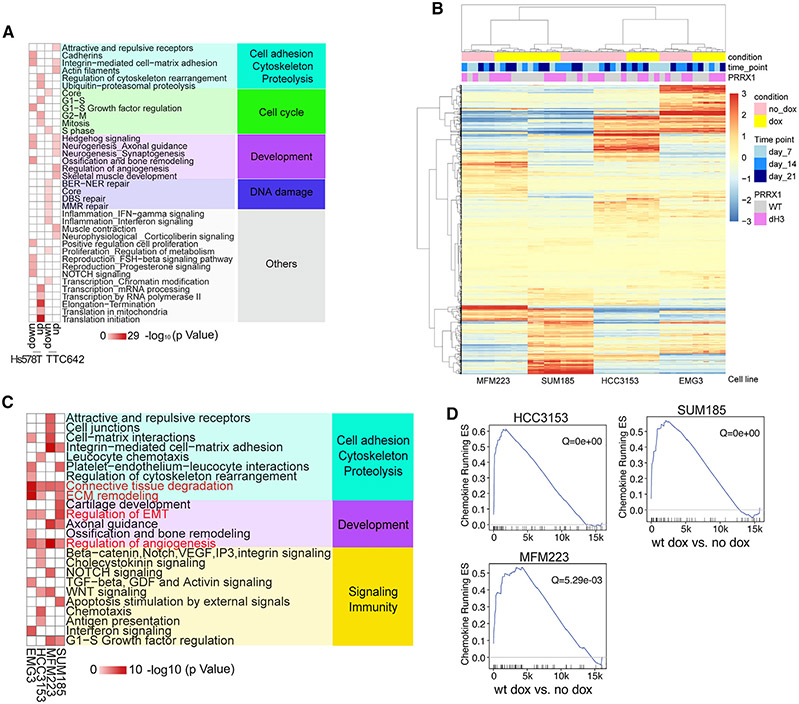
Figure 6. PRRX1 transcriptional targets.
(A) Metacore network analysis for Hs578T and TTC642 cell line DEGs following PRRX1 downregulation using TET-inducible shRNA at the 5-day time point.
(B) Heatmap showing clustering of basal (EMG3 and HCC3153) and luminal (SUM185 and MFM223) cell lines overexpressing WT or dH3 mutant PRRX1 based on expression of the union of DEGs (lfc > 1) in each cell line following PRRX1 induction by doxycycline (dox).
(C) Metacore network analyses for upregulated DEGs in basal (EMG3 and HCC3153) and luminal (MFM223 and SUM185) lines overexpressing WT PRRX1 (network gene list shown in Table S2; Figure 6C). For each cell line, dox-treated PRRX1-overexpressing samples (at three time points) were compared with untreated samples (corresponding to the same three time points) to identify DEGs.
(D) GSEA of the chemokine gene set in WT cell lines overexpressing PRRX1.

