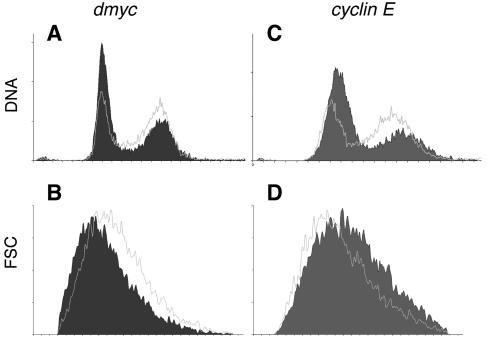
FIG. 1.
FACS analysis of S2 cells treated with dsRNA against gfp, dmyc, or cyclin E. Each panel shows a single cytometric profile of S2 cells 48 h after addition of the indicated dsRNA. The data shown are representative of three independent experiments (each performed in duplicate, with similar results). Outlined traces show control cells treated with gfp dsRNAi; filled diagrams show cells treated with dmyc RNAi (A and B) or cyclin E RNAi (C and D). (A and C) Cell cycle distribution; (B and D) forward scatter (FSC) indicative of cell size.

