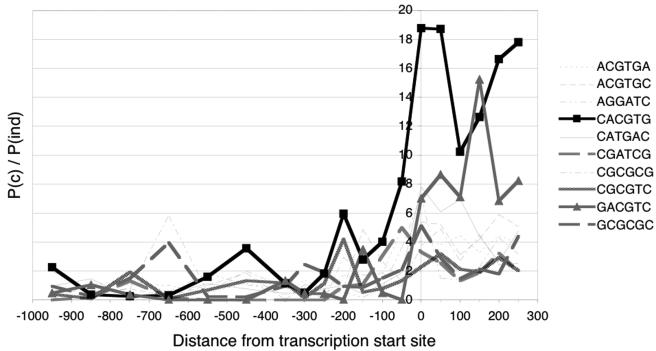
FIG. 4.
Evolutionary comparison of hexameric sequences in the promoter regions of D. melanogaster and D. pseudoobscura. The ratio of the probability that a particular motif is conserved [P(c)] to the probability that it occurs randomly [P(ind)] is plotted (see the supplemental material) for all motifs that are conserved in at least 10 gene pairs and that are significantly conserved in at least one window of the promoter (i.e., motifs for which the ratio of the probabilities differs by at least 7 standard deviations from the average ratio of all motifs for that window). The x axis is labeled as in Fig. 3.

