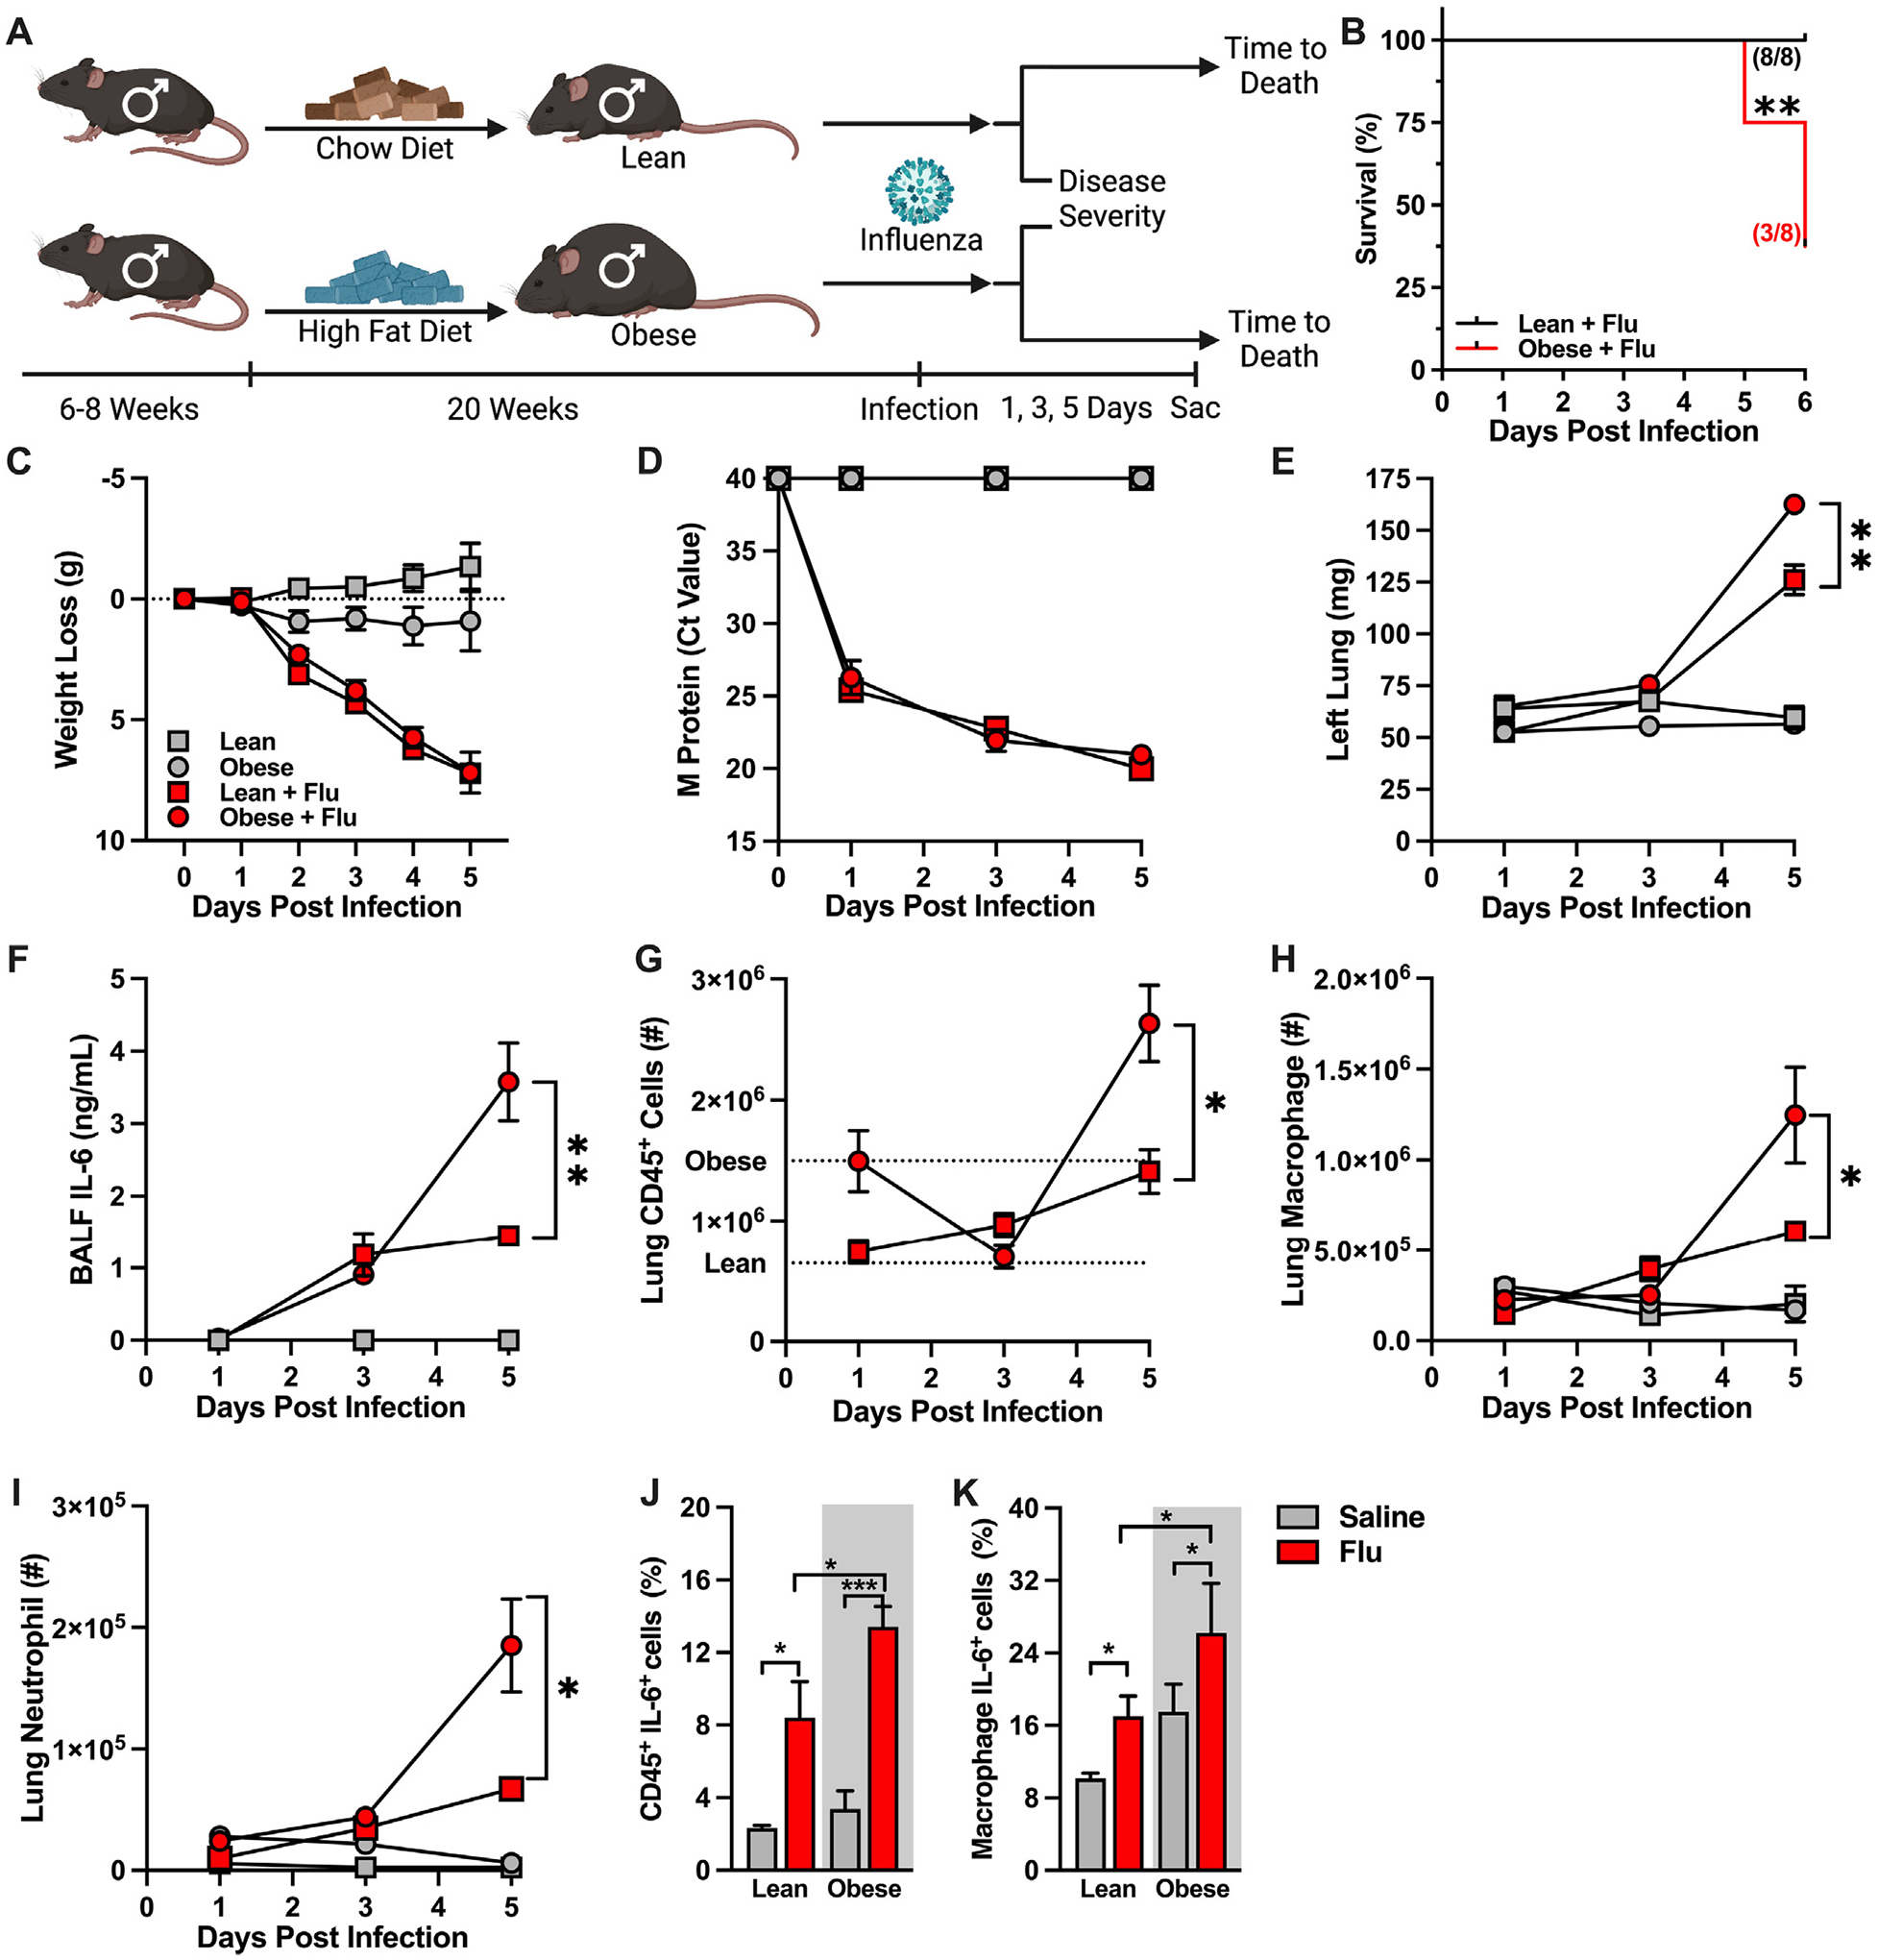
Fig. 2.

Obese male mice have increased lung inflammation in response to influenza infection compared to lean male mice. (A) Experimental design schematic. 6- to 8-week-old WT C57/BL6 males (3 independent experiments performed: 2 for time-to-death, 2 for kinetic analysis) were placed on either Chow Diet (CD, fat 10%, carbohydrate 70%, protein 20%; Research Diet #D12450J) or High-Fat Diet (HFD, fat 60%, carbohydrate 20%, protein 20%; Research Diet #D12492) for 20 weeks and subsequently intranasally challenged with saline or influenza virus. (B) Time-to-death curve of infected, lean, male and obese male mice (n = 8/group, result of 2 independent experiments). (C) Weight loss post-infection (n = 4–10/group; result of 2 independent experiments). (D) Lung viral M protein expression quantified via qPCR. (E) Left lung weight. (F) BALF IL-6 levels quantified via cytokine ELISA. (G) Total lung CD45+ immune cell infiltration, measured by flow cytometry. Average of saline-treated controls represented by dashed lines. (H) Lung macrophage absolute numbers (CD11bhiF4/80hi). (I) Lung neutrophil absolute numbers (CD11bhiGR1hi). (J–K) Immune cell inflammatory capacity, performed via ex vivo PMA-Ionomycin and brefeldin stimulation. Inflammatory cytokine production quantified via intracellular antibody accrual via flow cytometry. (J) Total lung CD45+ cell IL-6 production post ex vivo stimulation. (K) Lung macrophage IL-6 production post ex vivo stimulation. Means ± SEM. Student’s t test or one-way analysis of variance; *p < 0.05, **p < 0.01. ELISA = enzyme-linked immunosorbent assay; PMA = phorbol 12-myristate 13-acetate; SEM = standard error of the mean; WT = wild-type.
