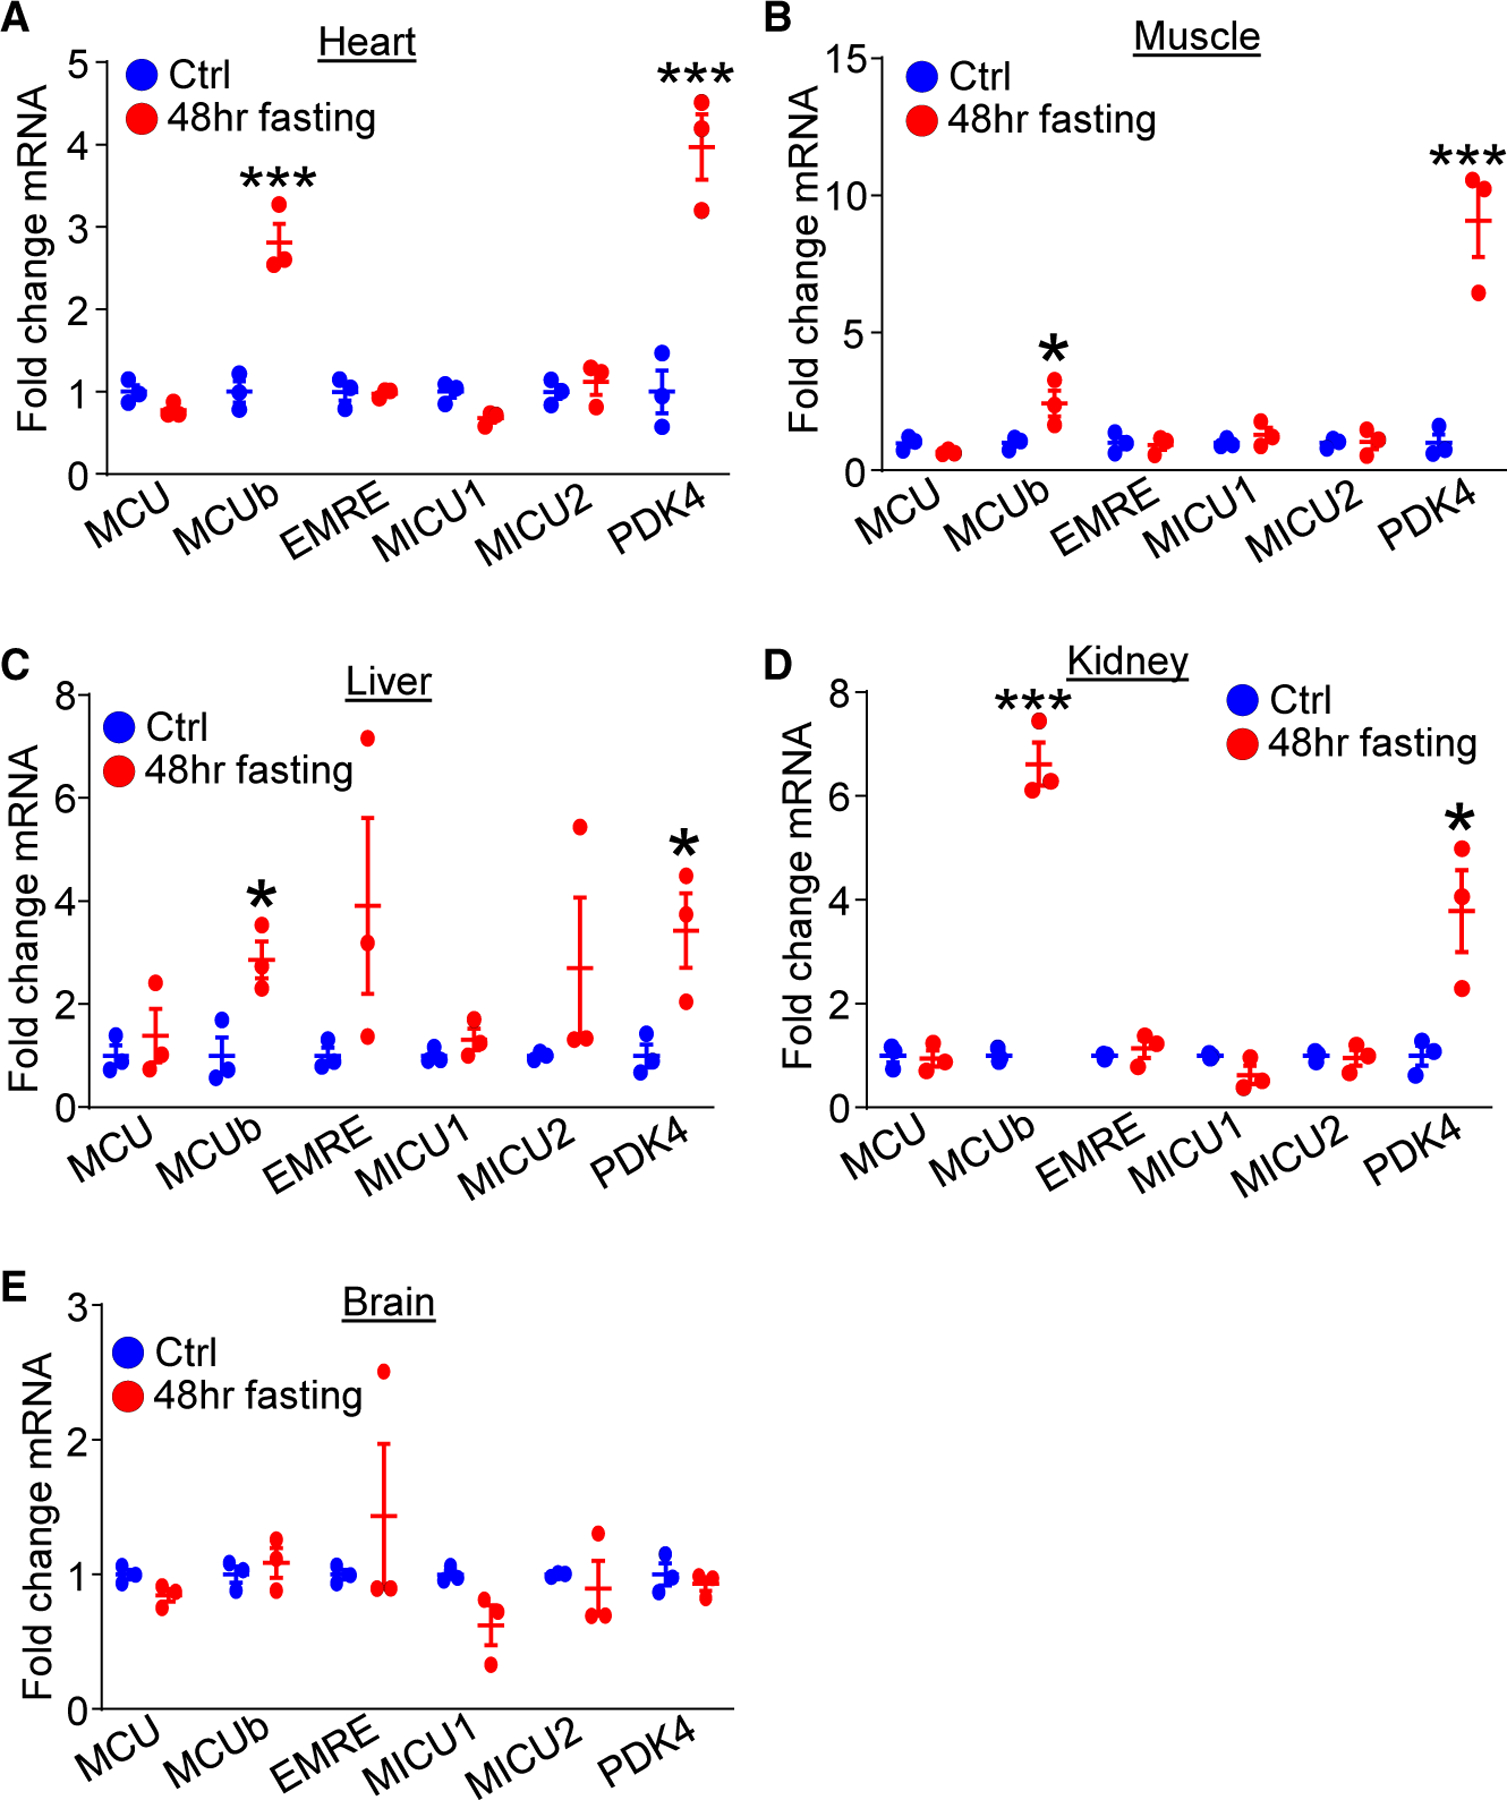
Figure 1. MCUb mRNA expression is induced by fasting in selected tissues.

(A–E) mRNA expression of MCU gene components among (A) heart, (B) skeletal muscle, (C) liver, (D) kidney and (E) brain from control-fed mice (ctrl) and mice challenged with 48-h fasting. PDK4 was used as a control for the fasting procedure. n = 3 per group. Data are presented as mean ± SEM. Student’s t test was used for statistical analysis.
*p < 0.05, ***p < 0.001.
