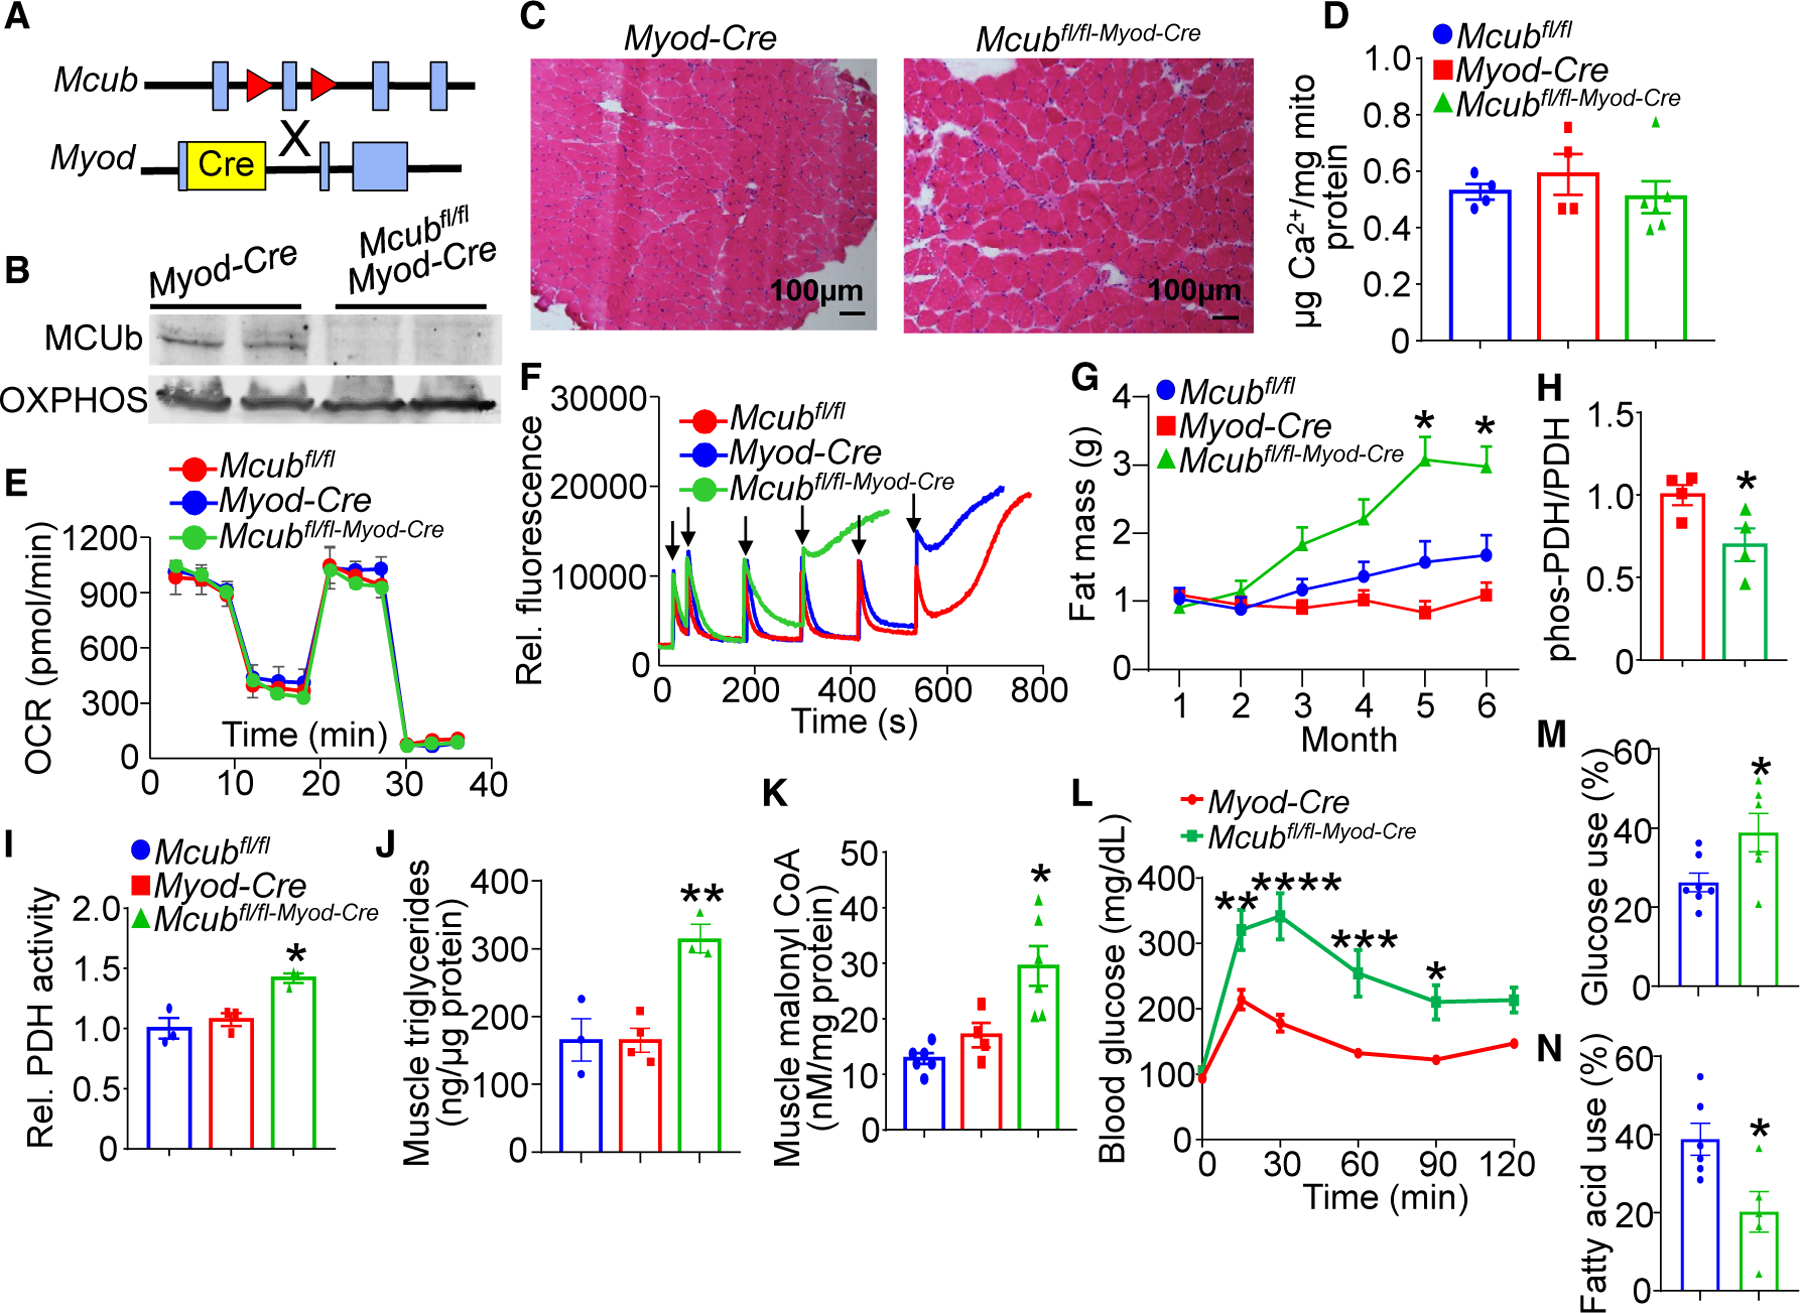
Figure 2. Skeletal muscle-specific deletion of Mcub shifts energy metabolism.

(A) Strategy to generate skeletal muscle-specific Mcub-deleted mice, with the Mcubfl/fl mouse crossed with the Myod-Cre mouse.
(B) Western blot of MCUb protein in isolated muscle mitochondria from the indicated groups of mice. Oxidative phosphorylation (OXPHOS) was used as a mitochondrial isolation and protein loading control.
(C) Representative hematoxylin and eosin (H&E)-stained soleus histological muscle sections at 100× magnification from the 2 genotypes of mice shown at 6 months of age.
(D) Quantification of baseline mitochondrial Ca2+ levels in isolated quadriceps mitochondria from the indicated groups of mice at 6 months of age. n = 4 in the Mcubfl/fl group, n = 4 in the Myod-Cre group, n = 6 in the Mcubfl/fl-Myod-Cre group. Data are presented as mean ± SEM. One-way ANOVA and Bonferroni’s multiple-comparisons test were used for statistical analysis.
(E) Oxygen consumption rate (OCR) measurement in quadriceps mitochondria from the indicated groups of mice at 4 months of age. n = 5 in the Mcubfl/fl group, n=5 in the Myod-Cre group, n = 7 in the Mcubfl/fl-Myod-Cre group.
(F) Mitochondrial Ca2+ retention capacity assay in isolated quadriceps mitochondria from the indicated groups of mice at 4 months of age. Calcium Green-5N was used as the Ca2+ indicator. The arrows indicate addition of 20 μM CaCl2 to the solution.
(G) MRI analyses of total body fat composition with aging in the indicated genotypes of mice. n = 7 in the Mcubfl/fl group, n = 8 in the Myod-Cre group, n = 8 in the Mcubfl/fl-Myod-Cre group. Data are presented as mean ± SEM. Two-way ANOVA and Bonferroni’s multiple-comparisons test were used for statistical analysis. *p < 0.05 versus either control group.
(H) Quantitation of western blotting of PDH phosphorylation over total PDH levels from the indicated genotypes of mice from quadriceps muscle at 6 months of age. n = 4 per group. Data are presented as mean ± SEM. Student’s t test was used for statistical analysis. *p < 0.05.
(I) Relative PDH enzymatic activity from quadriceps muscle from the indicated genotypes of mice at 6 months of age. n = 3 per group. Data are presented as mean ± SEM. One-way ANOVA and Bonferroni’s multiple comparison test were used for statistical analysis. *p < 0.05 versus either control group.
(J) Quadriceps triglyceride levels from the indicated mouse groups at 6 months of age. n = 3 in the Mcubfl/fl group, n = 4 in the Myod-Cre group, n = 3 in the Mcubfl/fl-Myod-Cre group. Data are presented as mean ± SEM. One-way ANOVA and Bonferroni’s multiple-comparisons test were used for statistical analysis. **p < 0.01 versus either control group.
(K) Quadriceps malonyl-CoA levels from the indicated genotypes of mice at 6 months of age. n = 6 in the Mcubfl/fl group, n = 4 in the Myod-Cre group, n = 6 in the Mcubfl/fl-Myod-Cre group. Data are presented as mean ± SEM. One-way ANOVA and Bonferroni’s multiple-comparisons test were used for statistical analysis. *p < 0.05 versus either control group.
(L) Glucose tolerance assay in the indicated groups of mice at 6 month of age. Data are presented as mean ± SEM. Two-way repeated-measures ANOVA and Bonferroni’s multiple-comparisons test were used for statistical analysis. *p < 0.05, **p < 0.01, ***p < 0.001, ****p < 0.0001.
(M) Glucose dependency with UK5099 in isolated flexor digitorum brevis (FDB) myofibers from the indicated groups, measured as the percentage of the basal OCR (detailed in STAR Methods). N = 7 in the Mcubfl/fl group, n = 6 in the Mcubfl/fl-Myod-Cre group. Data are presented as mean ± SEM. Student’s t test was used for statistical analysis. *p < 0.05.
(N) Fatty acid dependency with etomoxir in isolated FDB myofibers from the indicated groups, presented as the percentage of the basal OCR (detailed in STAR Methods). N=6 in the Mcubfl/fl group, n=5 in the Mcubfl/fl-Myod-Cre group. Data are presented as mean ± SEM. Student’s t test was used for statistical analysis. *p < 0.05.
