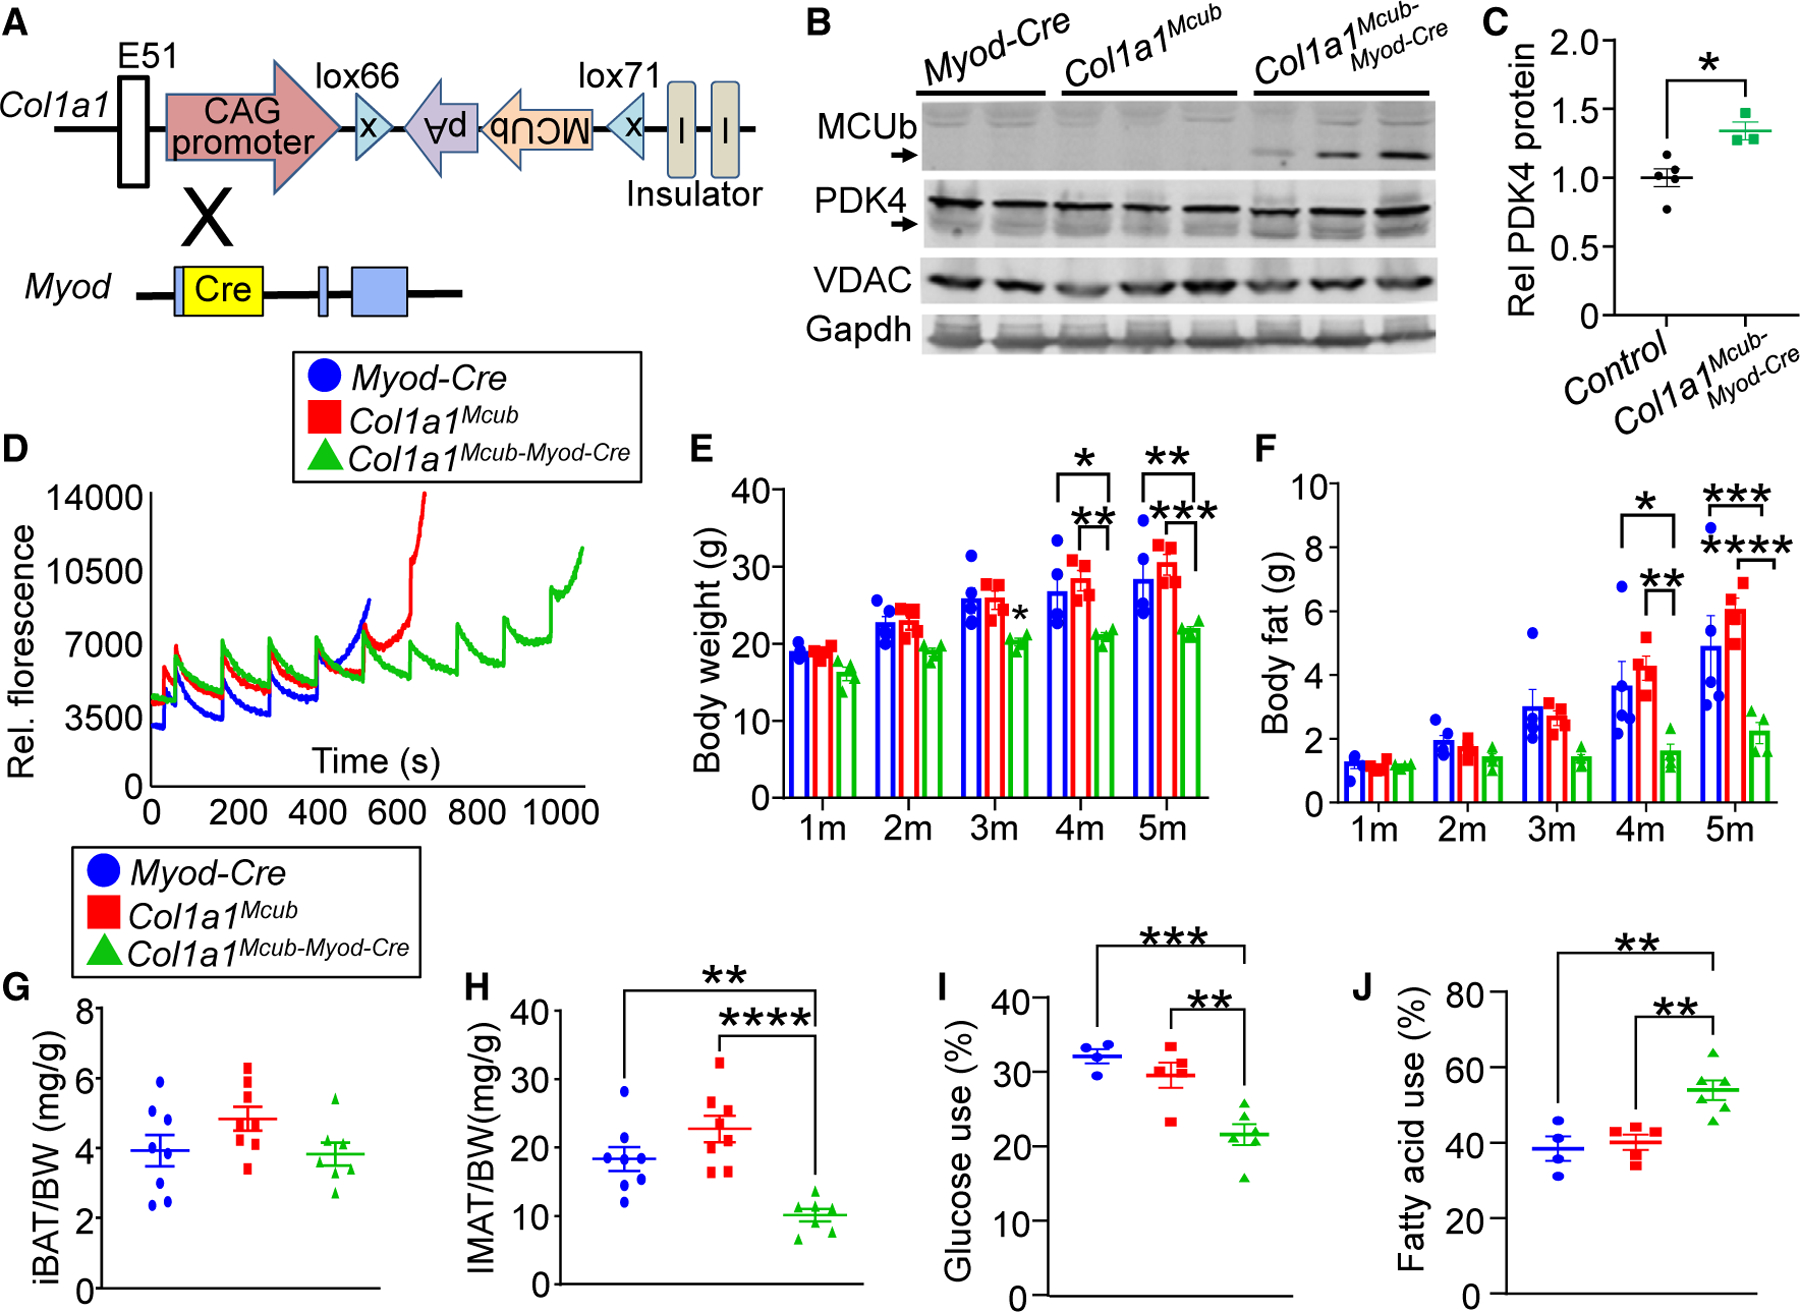
Figure 4. Muscle-specific MCUb induction showed reduced fat accumulation with enhanced PDK4 levels.

(A) Strategy to generate skeletal muscle-specific Mcub overexpression in mice using exon 51 insertion of the mouse MCUb cDNA into the Col1a1 locus in the opposite orientation with inverted loxP sites and a ubiquitous promoter. Col1a1-Mcub mice were crossed with Myod-Cre-expressing mice to generate recombination of the MCUb cDNA and constitutive expression in skeletal muscle.
(B) Western blot of the indicated proteins from quadriceps in the indicated groups of mice. Gapdh and VDAC were used as controls.
(C) Quantification of PDK4 protein expression as shown in (B). Student’s t test was used for statistical analysis. *p < 0.05.
(D) Ca2+ retention capacity assay in isolated quadriceps mitochondria from the indicated groups of mice at 3–4 months of age. Calcium Green-5N was used as the Ca2+ indicator, and Ca2+ additions were given at each pulse point.
(E) MRI analyses of total body mass with aging in the indicated genotypes of mice. n = 4 per group. Data are presented as mean ± SEM. Two-way ANOVA and Bonferroni’s multiple comparison test were used for statistical analysis. *p < 0.05, **p < 0.01, ***p < 0.001.
(F) MRI analyses of total body fat composition with aging in the indicated genotypes of mice. n = 4 per group. Data presented as mean ± SEM. Two-way ANOVA and Bonferroni’s multiple-comparisons test were used for statistical analysis. *p < 0.05, **p < 0.01, ***p < 0.001, ****p < 0.0001.
(G) Interscapular brown adipose tissue (iBAT) weight-to-body weight ratio in the indicated genotypes of mice. n = 8 in the Myod-Cre group, n = 8 in the Col1a1Mcub group, n = 7 in the Col1a1Mcub-Myod-Cre group. Data are presented as mean ± SEM. One-way ANOVA and Bonferroni’s multiple comparison test were used for statistical analysis.
(H) Intermuscular adipose tissue (IMAT) weight-to-body weight ratio in the indicated genotypes of mice. n = 8 in the Myod-Cre group, n = 8 in the Col1a1Mcub group, n = 7 in the Col1a1Mcub-Myod-Cre group. Data are presented as mean ± SEM. One-way ANOVA and Bonferroni’s multiple comparison test were used for statistical analysis. **p < 0.01, ****p < 0.0001.
(I) Glucose dependency with UK5099 in isolated FDB myofibers from the indicated groups of mice, measured as percentage of basal OCR (detailed in STAR Methods). n = 4 in the Myod-Cre group, n = 5 in the Col1a1Mcub group, n = 6 in the Col1a1Mcub-Myod-Cre group. Data are presented as mean ± SEM. One-way ANOVA and Bonferroni’s multiple comparison test were used for statistical analysis. **p < 0.01, ***p < 0.001.
(J) Fatty acid dependency with etomoxir in isolated FDB myofibers from the indicated groups of mice, measured as the percentage of basal OCR (detailed in STAR Methods). n = 4 in the Myod-Cre group, n = 5 in the Col1a1Mcub group, n = 6 in the Col1a1Mcub-Myod-Cre group. Data are presented as mean ± SEM. One-way ANOVA and Bonferroni’s multiple comparison test were used for statistical analysis. **p < 0.01.
