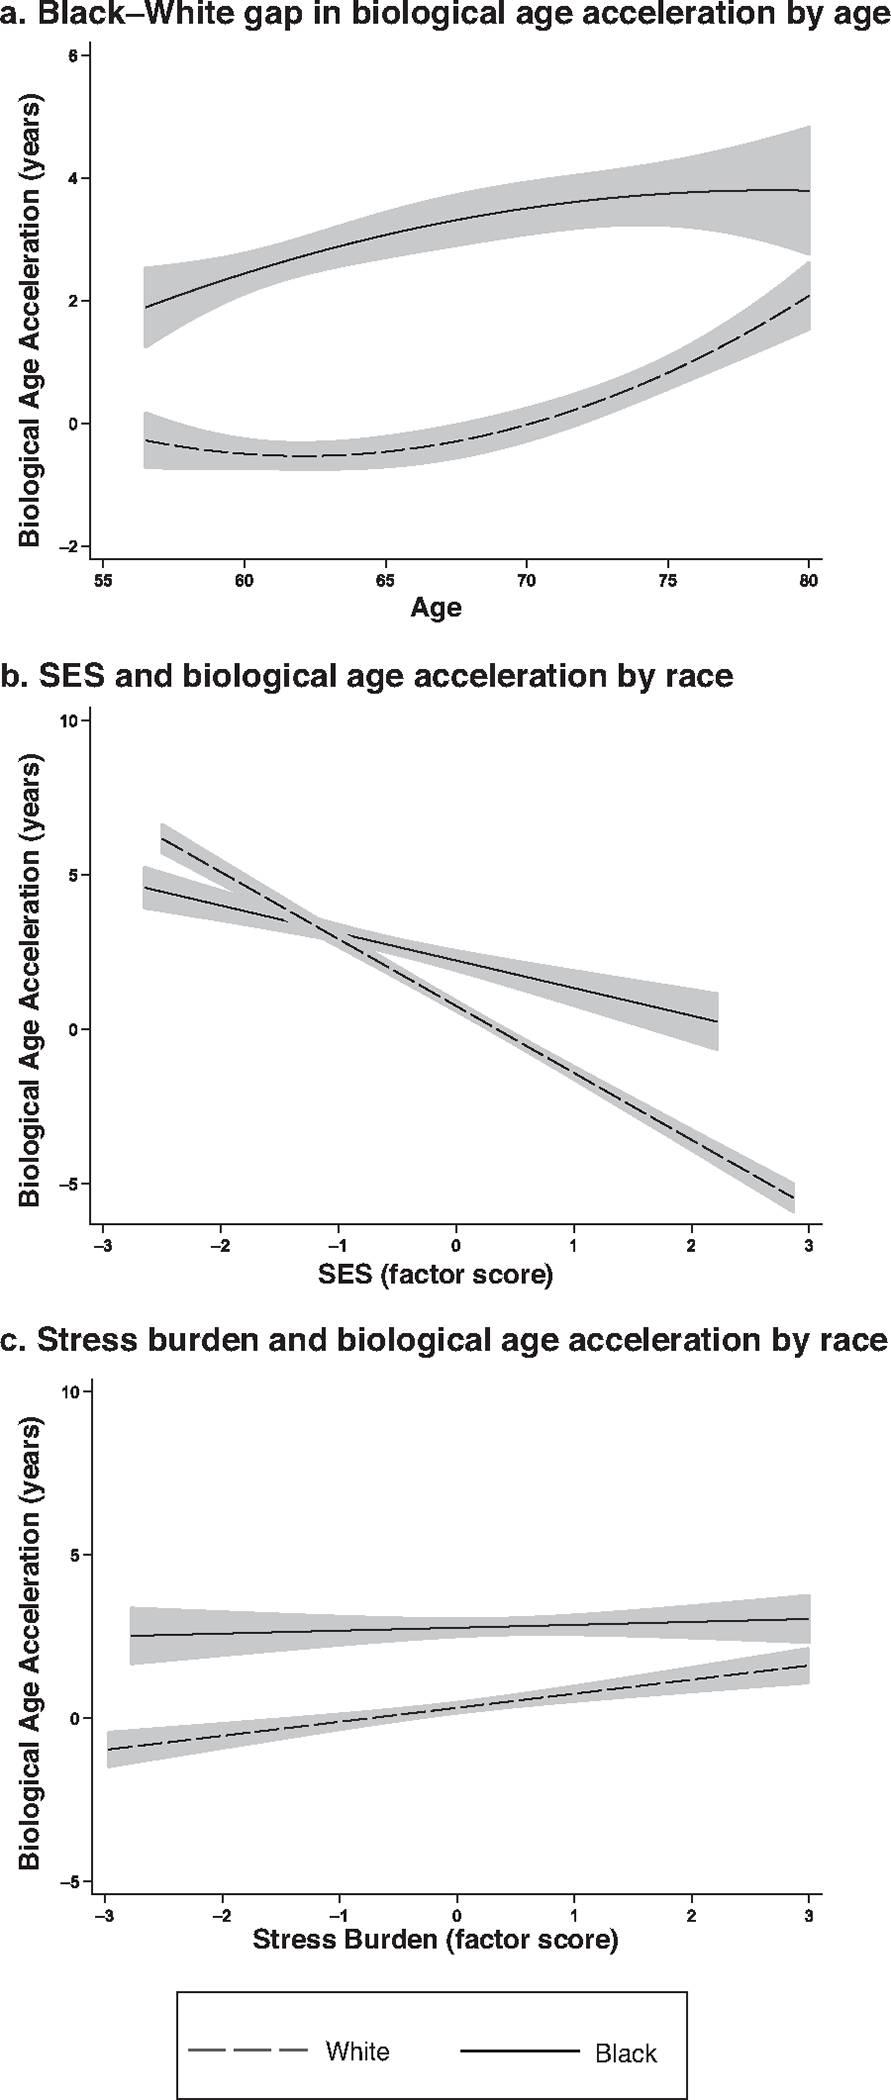
Fig. 1.

Associations of age, SES, and stress burden with biological age acceleration (PhenoAge algorithm) by race: Unadjusted Black–White disparity in biological age acceleration by age (panel a), unadjusted association between SES and biological age acceleration by race (panel b), and unadjusted association between stress burden and biological age acceleration by race (panel c). n = 6,782.
