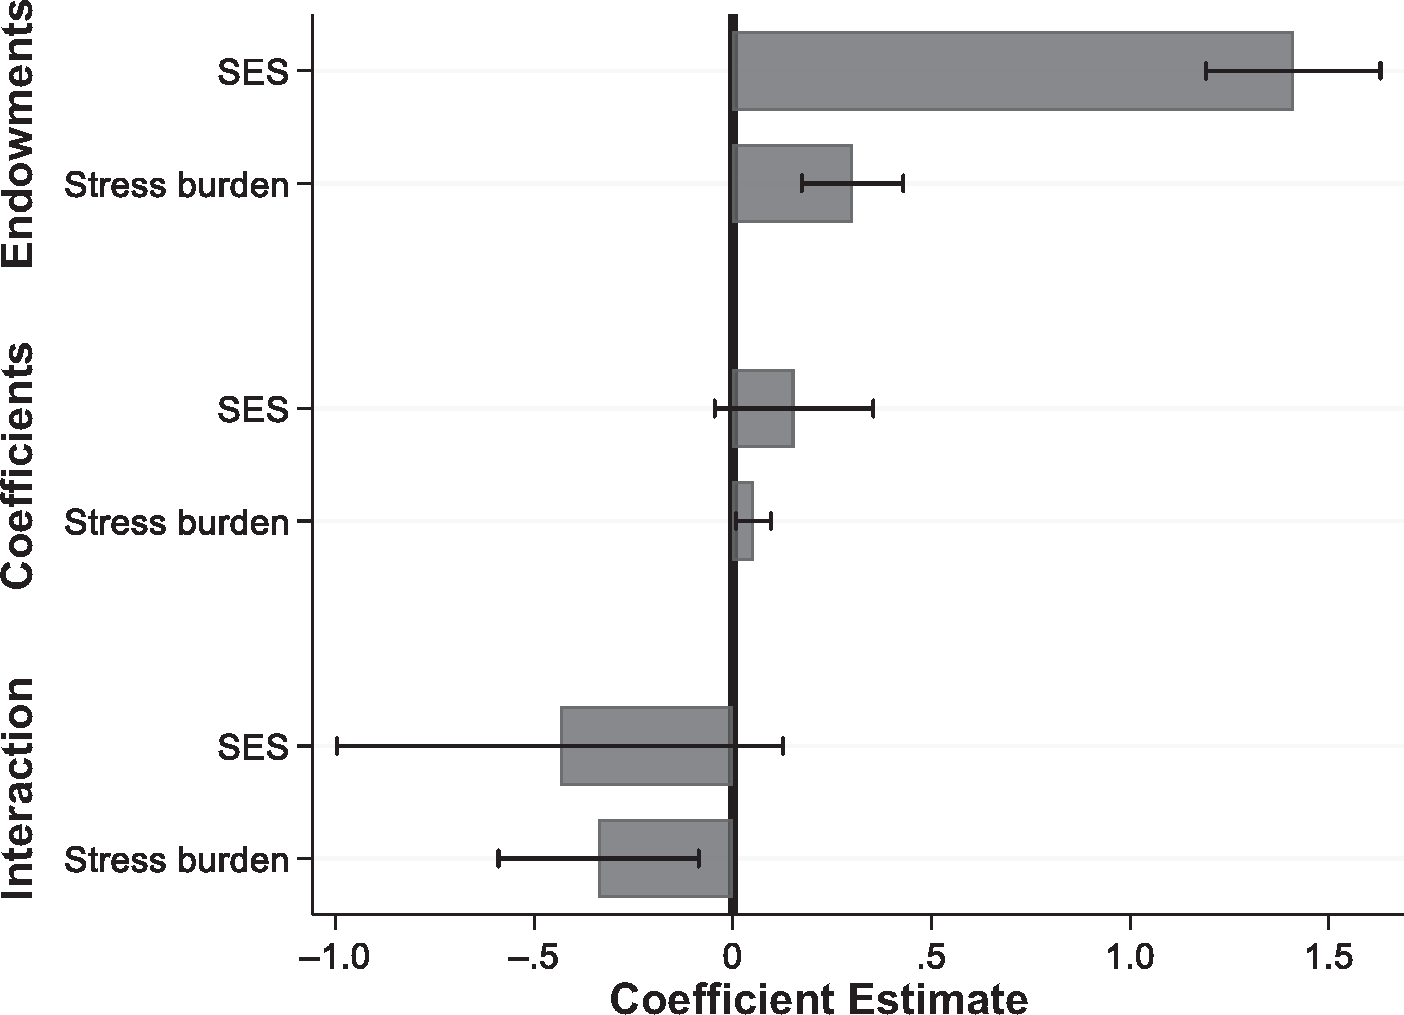
Fig. 2.

Contributions of life course SES and stress burden to Black–White disparities in biological age acceleration (PhenoAge algorithm). Results of Kitagawa–Blinder–Oaxaca decomposition of racial disparities in the PhenoAge measure of biological age acceleration. Analyses included the full set of covariates (age, sex, cohort, region of birth, SES, and stress burden). In the interest of space, only estimates for SES and stress burden are displayed. Full decomposition results are shown in Table 3. Whiskers represent 95% confidence intervals.
