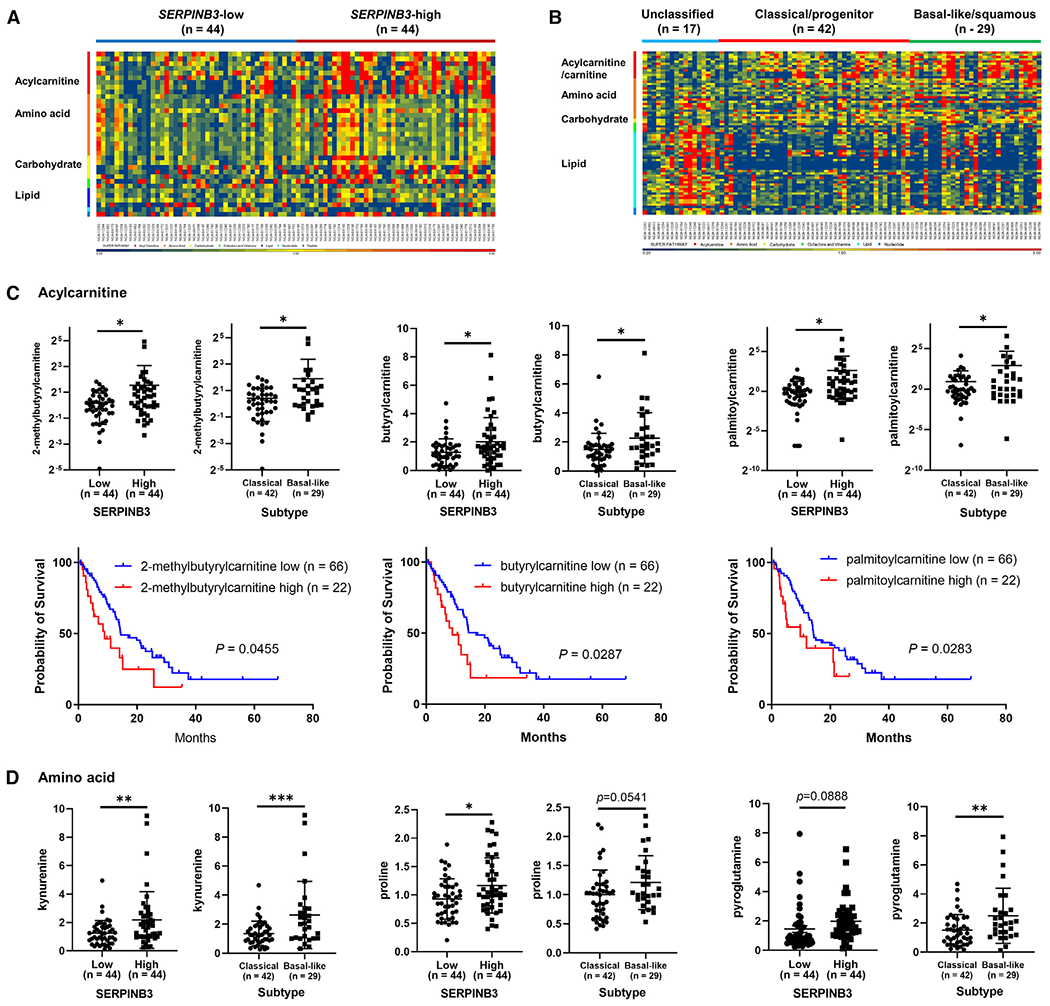
Figure 5. Upregulation of acylcarnitine/carnitine and amino acid metabolism in both SERPINB3-high and basal-like/squamous PDAC tumors.

(A and B) Heatmaps show metabolite patterns in human PDAC (n = 88) with high and low SERPINB3 expression level (A) or by tumor subtype (B). Red shows upregulation of metabolites, blue indicates low abundance. In (A), 32 metabolites were significantly increased and 3 were decreased in SERPINB3-high tumors compared with SERPINB3-low tumors (p < 0.05). SERPINB3-low, n = 44; SERPINB3-high, n = 44. In (B), 15 metabolites were significantly increased and 2 were decreased in the basal-like/squamous subtype compared with the classical/progenitor subtype (p < 0.05). Unclassified subtype, n = 17; classical/progenitor subtype, n = 42; basal-like/squamous subtype, n = 29. Acylcarnitines/carnitine, amino acids, and carbohydrates are increased in SERPINB3-high PDAC tumors and also in basal-like/squamous PDAC tumors.
(C and D) Abundance patterns for individual acylcarnitines (C) and amino acids (D) by tumor SERPINB3 status and subtype. Data are presented as the mean ± SD. In the graphs of 2-methylbutyrylcarnitine and palmitoylcarnitine, negative values of standard deviation (−SD) are not shown on the logarithmic y axis; *p < 0.05, **p < 0.01, ***p < 0.005 by unpaired two-tailed Student’s t test. The bottom row in (C) shows Kaplan-Meier plots and log-rank test results demonstrating the association of each acylcarnitine with PDAC patient survival. The comparison was conducted between patients in the upper 25% quartile and the lower 75% of each acylcarnitine level. Higher levels of 2-methylbutyrylcarnitine, butyrylcarnitine, and palmitoylcarnitine were associated with poor patient survival. See also Tables S3 and S4.
