
FIG. 5.
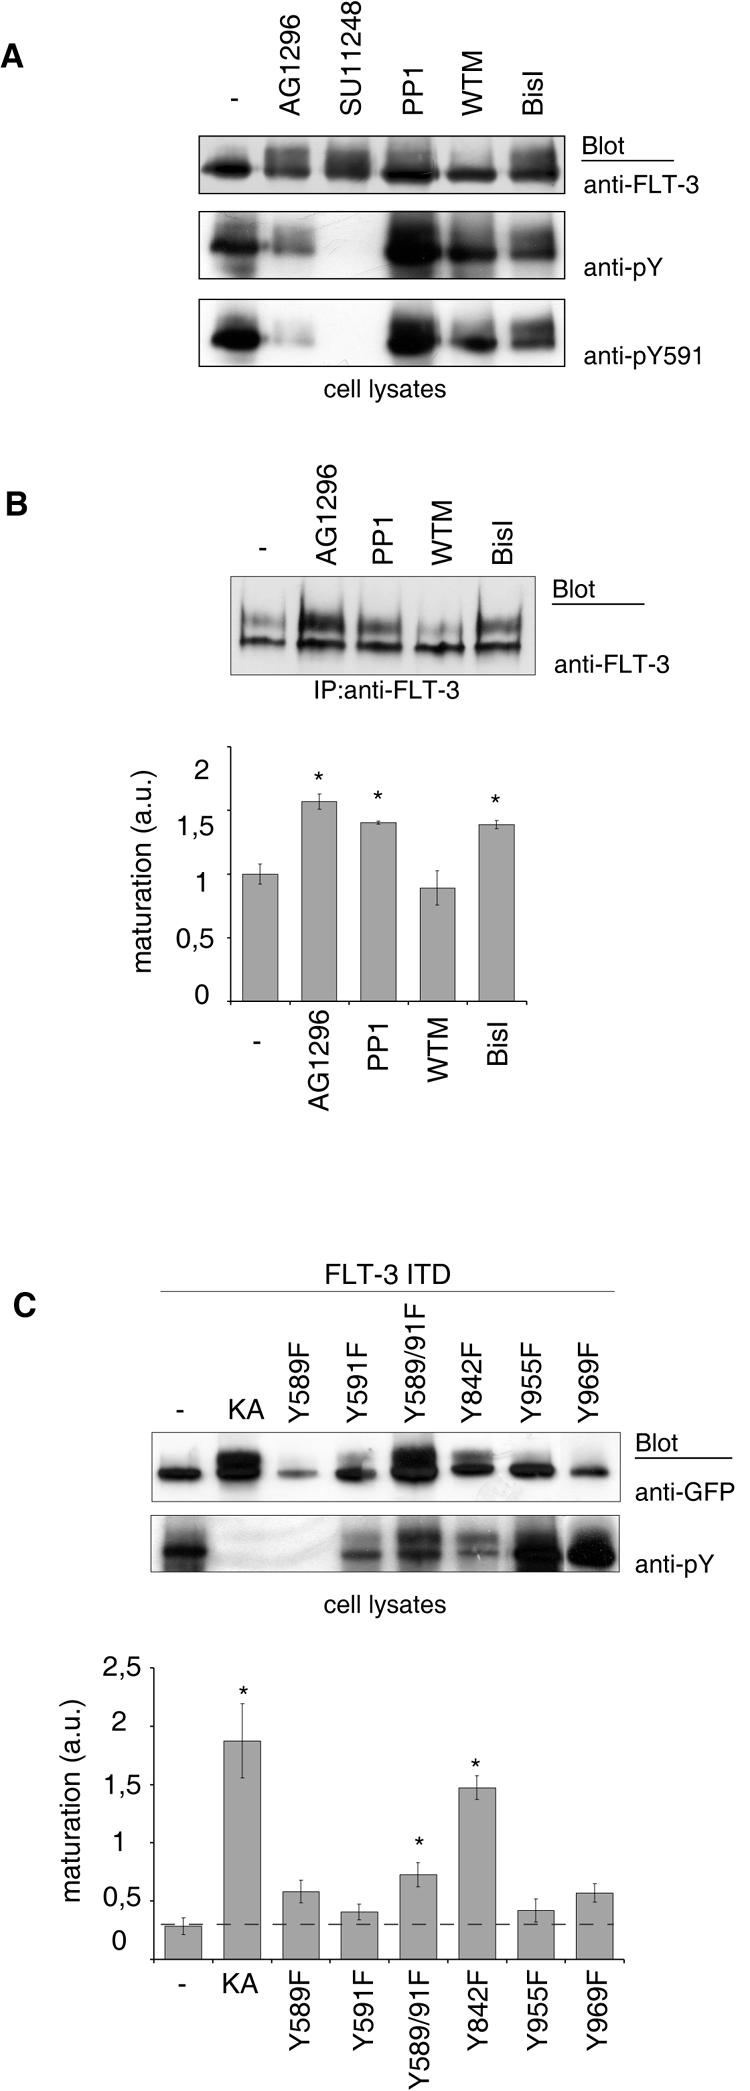
Roles of signal transduction and of individual phosphorylation sites in FLT-3 maturation. FLT-3 ITD-expressing COS-7 cells (A) or MV4-11 cells (B) were treated with the FLT-3 tyrosine kinase inhibitor AG1296 or SU11248, the Src family kinase inhibitor PP1, the phosphatidylinositol 3-kinase inhibitor wortmannin (WTM), or the PKC family inhibitor BisI for 3 h. FLT-3 expression was analyzed by immunoblotting of lysate aliquots (A) or of FLT-3 immunoprecipitates (IP) (B, upper panel). The results of three experiments with MV4-11 cells were quantitated and are shown in the lower panel (mean ± SEM; the asterisk indicates a P value of <0.05). a.u., arbitrary units. (C) The indicated mutants of EGFP-tagged FLT-3 ITD were expressed in COS-7 cells. Expression and phosphorylation were evaluated by immunoblotting of lysate aliquots; representative results are shown in the upper panels. The results of three or four independent experiments were quantitated by densitometric scanning, and maturation was calculated as the ratio of 150-kDa signals to 130-kDa signals; the results are shown in the lower panel (mean ± SEM; the asterisk indicates a P value of <0.05). The broken horizontal line indicates the control level of maturation, for better comparison.