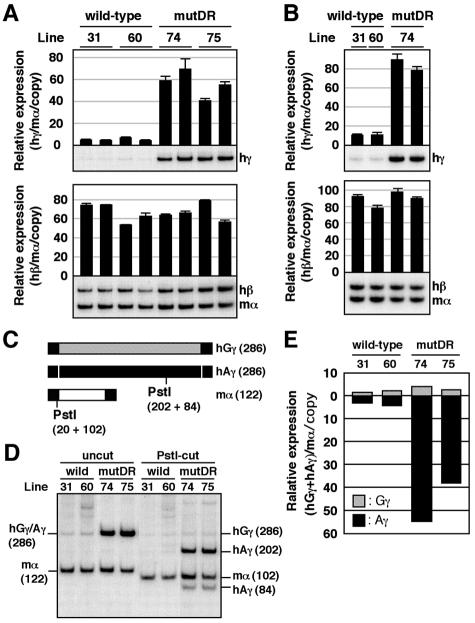
FIG. 3.
Expression of human β-like globin genes in the adult spleens of mutDR YAC TgM. (A) Semiquantitative RT-PCR analysis of β-like globin gene expression. Total RNA from two individuals from each line of TgM was prepared from the spleens of 1-month-old anemic mice. Expression of human γ (hγ)- and human β (hβ)-globin in comparison to the endogenous mouse α (mα)-globin genes was analyzed separately by semiquantitative RT-PCR. The signals for hγ-globin at 21 cycles and hβ/mα-globin at 12 cycles were quantified by PhosphorImager, and the ratios of hγ/mα (top) and hβ/mα (bottom) were calculated (the mouse α signal at 12 cycles was set at 100%, and the values are normalized by transgene copy numbers) and statistically analyzed (n = 3). The average and standard deviation are graphically depicted. Representative results are shown below each panel. (B) Total RNA from the peripheral blood of TgM was analyzed as in panel A. The PCR cycle numbers used were 20 and 11 for hγ-globin and hβ/mα-globin, respectively. (C to E) RT-PCR analysis of human Gγ/Aγ transcription ratios in the adult spleen. (C) Schematic representation of RT-PCR products amplified with primer sets specific for human γ- (common to both human Gγ- and Aγ-) and mouse α-globin genes. The positions of the primers (solid box), the total length of each RT-PCR product (hatched box for human Gγ, solid box for human Aγ, and open box for mouse α; sizes in base pairs are indicated in parentheses), and the positions of PstI restriction sites with the fragment sizes produced after enzyme digestion are shown in parentheses. (D) PstI digestion of RT-PCR products. The PCR products were digested with PstI and separated on an 8% polyacrylamide gel. A PstI site in the Aγ but not in the Gγ gene enabled separation and quantification of products derived from the two individual γ-globin genes. To internally control for complete PstI digestion, a PstI site was artificially introduced into the mouse α-globin gene PCR primer. The sizes of the expected bands are shown (on the left for undigested PCR products, and on the right for those digested with PstI; sizes in base pairs are indicated in parentheses). (E) The contribution of the Gγ and Aγ genes relative to total γ-globin synthesis are quantified from panel D and plotted as hatched and solid bars, respectively. Average values from two independent experiments are shown.

