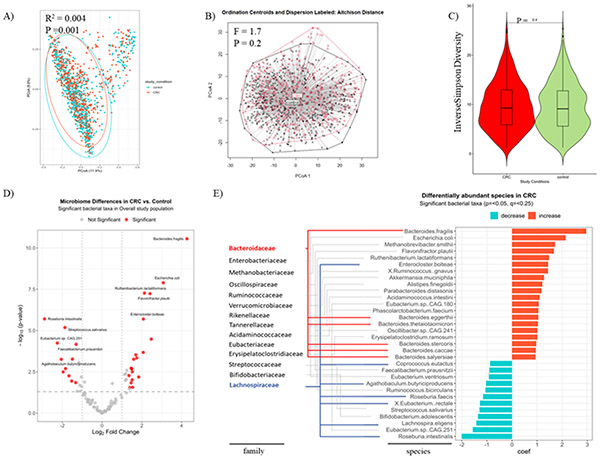
Figure 1. Fecal microbiome compositions and differentially abundant species between CRC and control subjects.
(A) Variations in fecal microbiome composition (β diversity) across disease statuses assessed on Bray-Curtis dissimilarity matrix and tested using PERMANOVA. (B) Aitchison plot and distances from centroids based on disease statuses. (C) Alpha diversity Inverse Simpson index of the gut microbiome community across disease status.
A volcano plot showing varying enrichment of statistically significant bacterial taxa (red dots) in the CRC compared to control subjects (D) and a bar plot showing the coefficient change of significant taxa of species level in CRCs compared to controls using a multivariable linear model by disease status adjusting for country, BMI, gender, DNA extraction methods of the total 11 cohorts from the CuratedMetagenomeData (E). The analysis was done under the species level, however, both species and family taxonomy ranks are shown in (E). Both Bacteroidaceae (blue lines) and Lachnospiraceae (red lines) stand out for exhibiting the greatest numbers of species enrichment, with 6 and 7 species, respectively. The criteria for significance included a p-value < 0.05, a q-value to control the False-Discovery Rate of < 0.25, and a log2 Fold Change of +/− 1.25.

