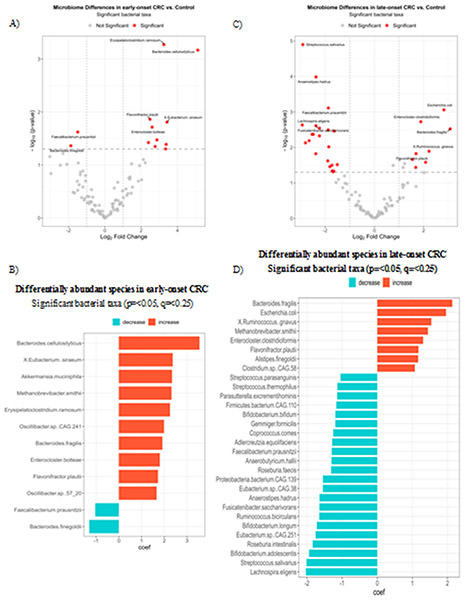
Figure 2. Differentially abundant species in early- and late-onset CRC vs. Control.
A volcano plot showing differentially abundant species (red dots) in early-onset CRC vs. control subjects of respective age group of <50 years (A) and a bar plot showing the coefficient change of significant taxa of species-level using a multivariable linear model by disease status adjusting for country, BMI, gender, DNA extraction methods of early-onset CRC (B). A volcano plot showing differentially abundant species (red dots) in late-onset CRC vs. subjects of respective age group of >65 years (C). A bar plot showing the coefficient change of significant taxa of species-level using a multivariable linear model by disease status adjusting for country, BMI, gender, DNA extraction methods of late-onset CRC vs. control subjects (D). The criteria for significance included a p-value < 0.05, a q-value to control the False-Discovery Rate of < 0.25, and a log2 Fold Change of +/− 1.25.

