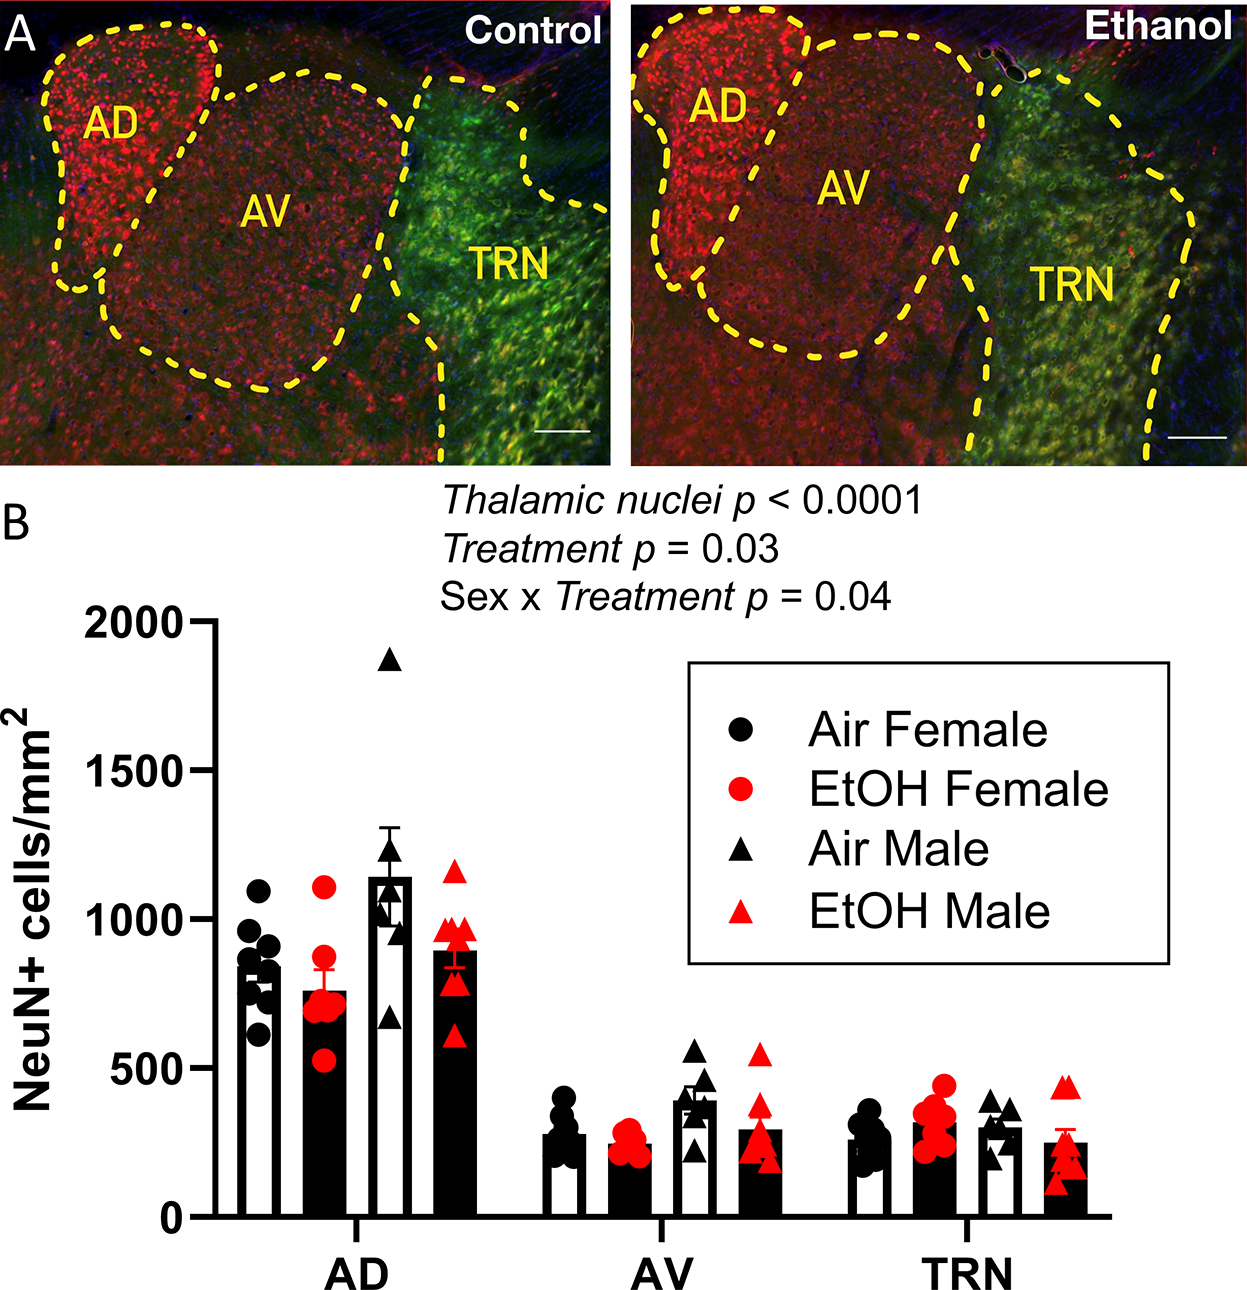
Figure 2. Neonatal ethanol (EtOH) exposure did not significant affect neuronal densities in anterior thalamic nuclei at postnatal days 60–70.

A) Sample images of neurons stained with anti-NeuN antibodies (red) and Venus+ GABAergic interneurons (green) from the Air (control) and EtOH groups (scale bars 100 μm). B) Summary graph illustrating the effect of third trimester-equivalent EtOH exposure on neuronal densities in the anterodorsal (AD), anteroventral (AV), or thalamic reticular (TRN) nuclei. Data were analysed by three-way ANOVA of log-transformed data. Posthoc analysis with the Holm-Šídák’s test yielded treatment p values ranging from >0.75 to >0.9 for both males and females in the AD nucleus, AV nucleus, and TRN. Control female, n=8 pups from 6 litters; EtOH female, n=7 pups from 4 litters; control male, n=6 pups from 3 litters; EtOH male, n=8 pups from 6 litters.
