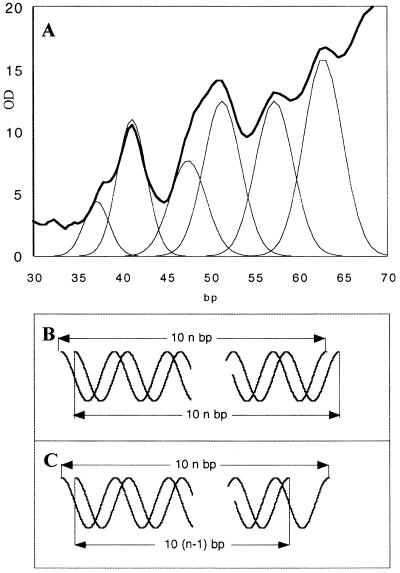
Figure 4.
(A) Densitometer trace of the digestion profile in Figure 2B, lane j, with resolution into its contributing Gaussian curves. The positions of the Gaussian bands are 37, 41, 47.5, 51.5, 57.5 and 62.5 bp. (B and C) Two possible double-stranded fragments that can contribute to the 10n and 10n + 5 bp ladders, respectively. (B) The two DNA chains are of equal size. (C) One of the DNA chains is 10 nt shorter. OD, optical density.

