
Figure 1: De novo NAD+ Biosynthesis suppression is a component of nephrotoxic AKI.
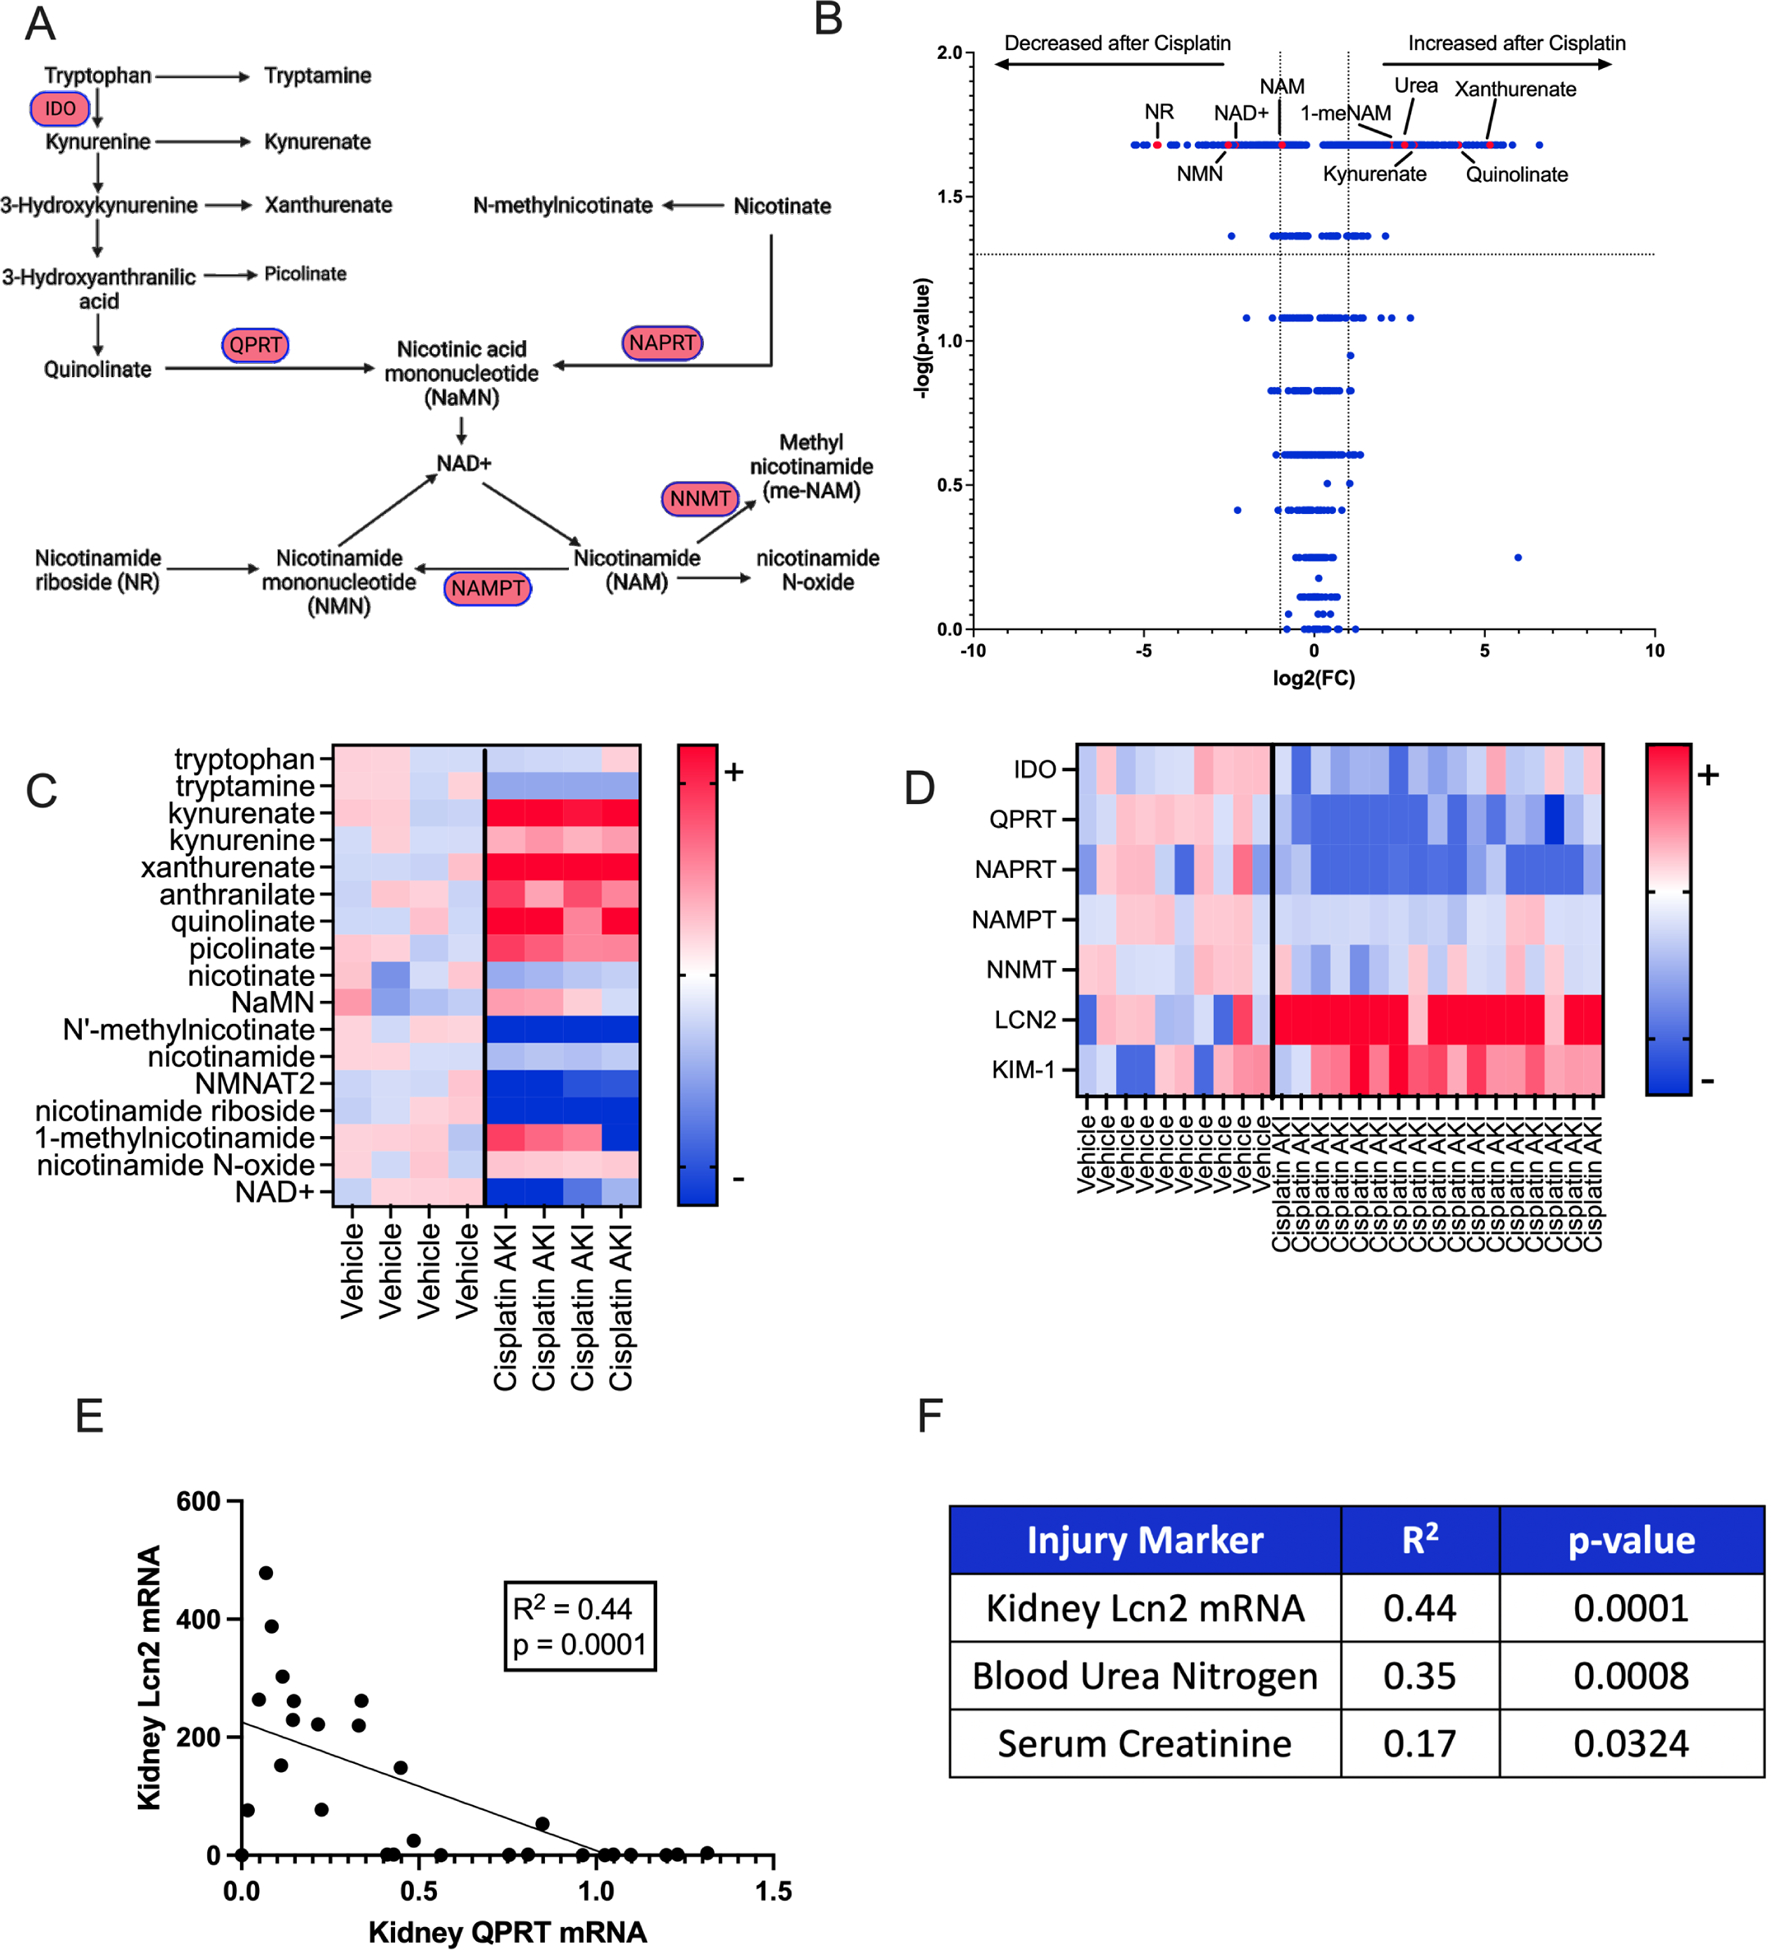
a. Schema of NAD+ Biosynthesis. b. Volcano plot of mouse kidney metabolites from mice that received cisplatin or vehicle. P-values calculated using Mann-Whitney. Dotted lines indicate p value greater of 0.05 (horizontal) and fold change < or > 2 (vertical). c. Heat map showing individual values of selected metabolites. Values are normalized to average of vehicle animals and presented as fold change. Darkest colors indicate fold change ≥6 (red) or ≤-6 (blue). d. Heatmap representing gene expression of selected genes in WT male mice who received 25mg/kg IP cisplatin (n=17) or Vehicle (n=10). Data are normalized to the vehicle average and expressed as fold change. Darkest colors indicate fold change ≥5 (red) or ≤-5 (blue). e. Correlation of kidney QPRT expression to kidney Lcn2 expression in WT mice that received cisplatin or vehicle. Correlation and p-value calculation using a simple linear regression, f. Correlation of 3 kidney injury markers to kidney QPRT mRNA expression. Correlation and p-values calculated with simple linear regression.