
Figure 2: QPRT expression mediates NAD+ and ATP.
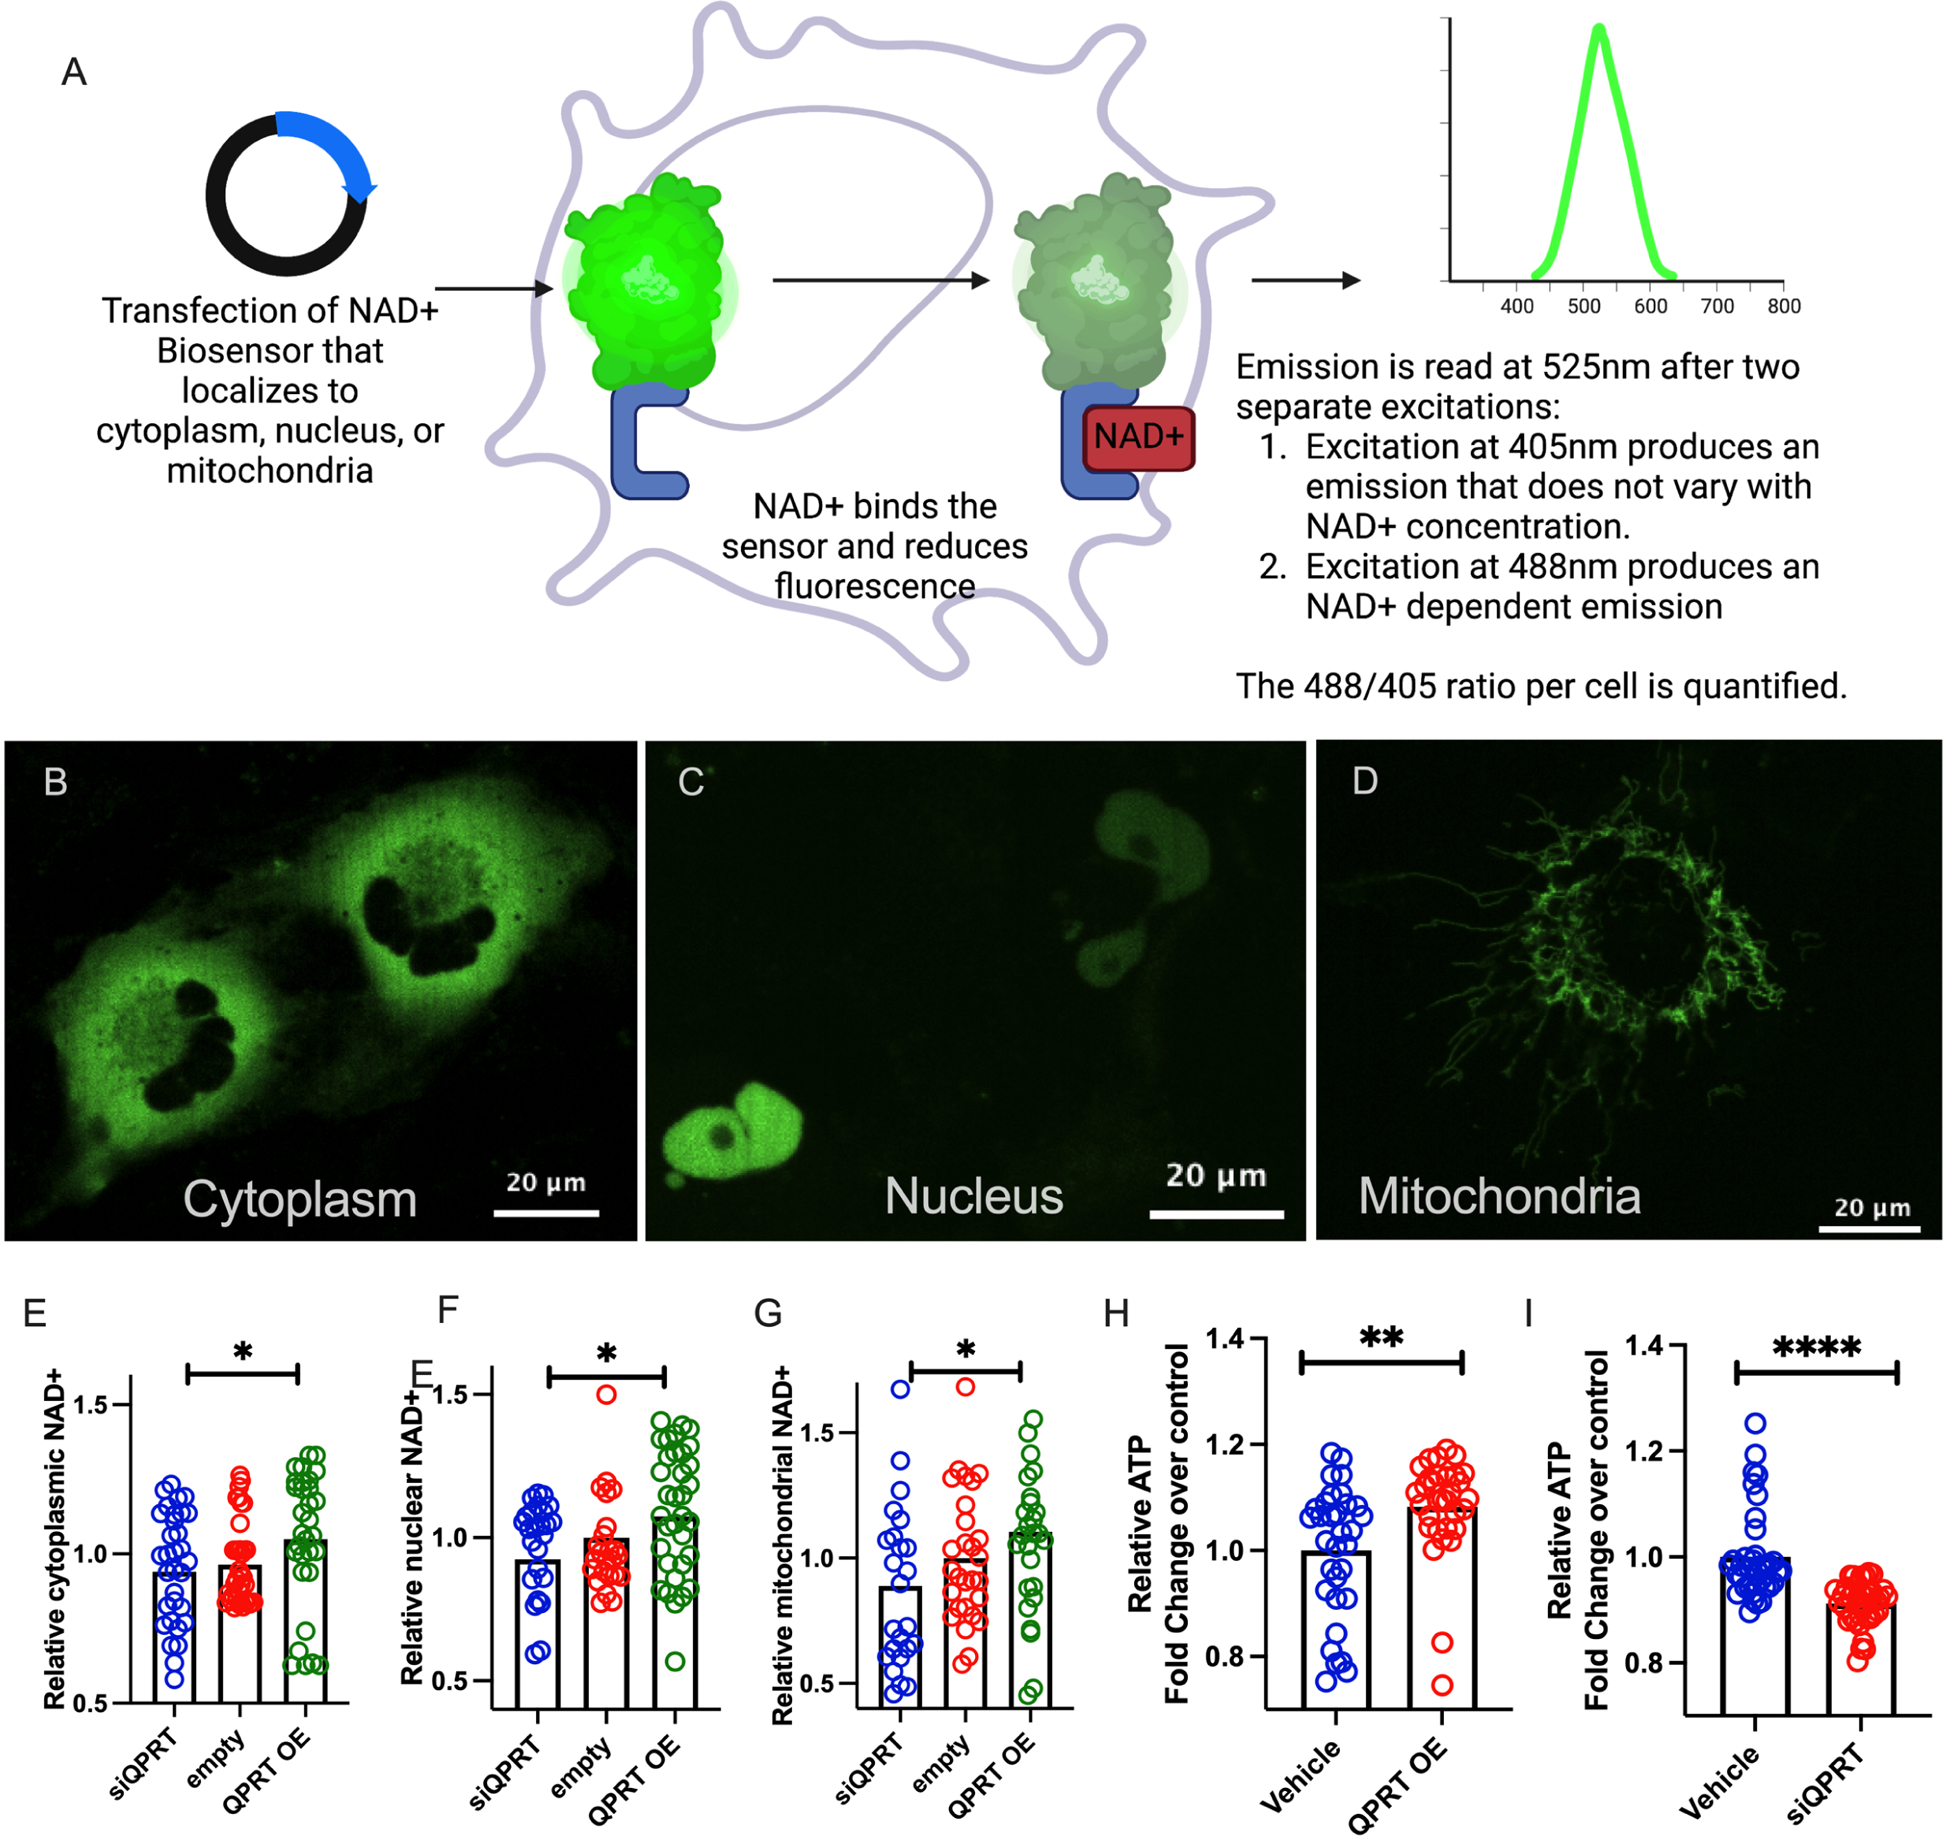
a. Schematic describing a compartment-specific NAD+ biosensor. b-d Representative images of compartment-specific NAD+ biosensor in use. Relative cytoplasmic (e), nuclear (f), and mitochondrial (g) NAD+ in QPRT overexpression (OE), control, and siQPRT knock down in HK-2 cells. h. Relative ATP in QPRT OE and Control I. Relative ATP in siQPRT and Control. P-values were calculated using Mann-Whitney. * = p<0.05, ** = p<0.01, *** = p<0.001, **** = p<0.0001.