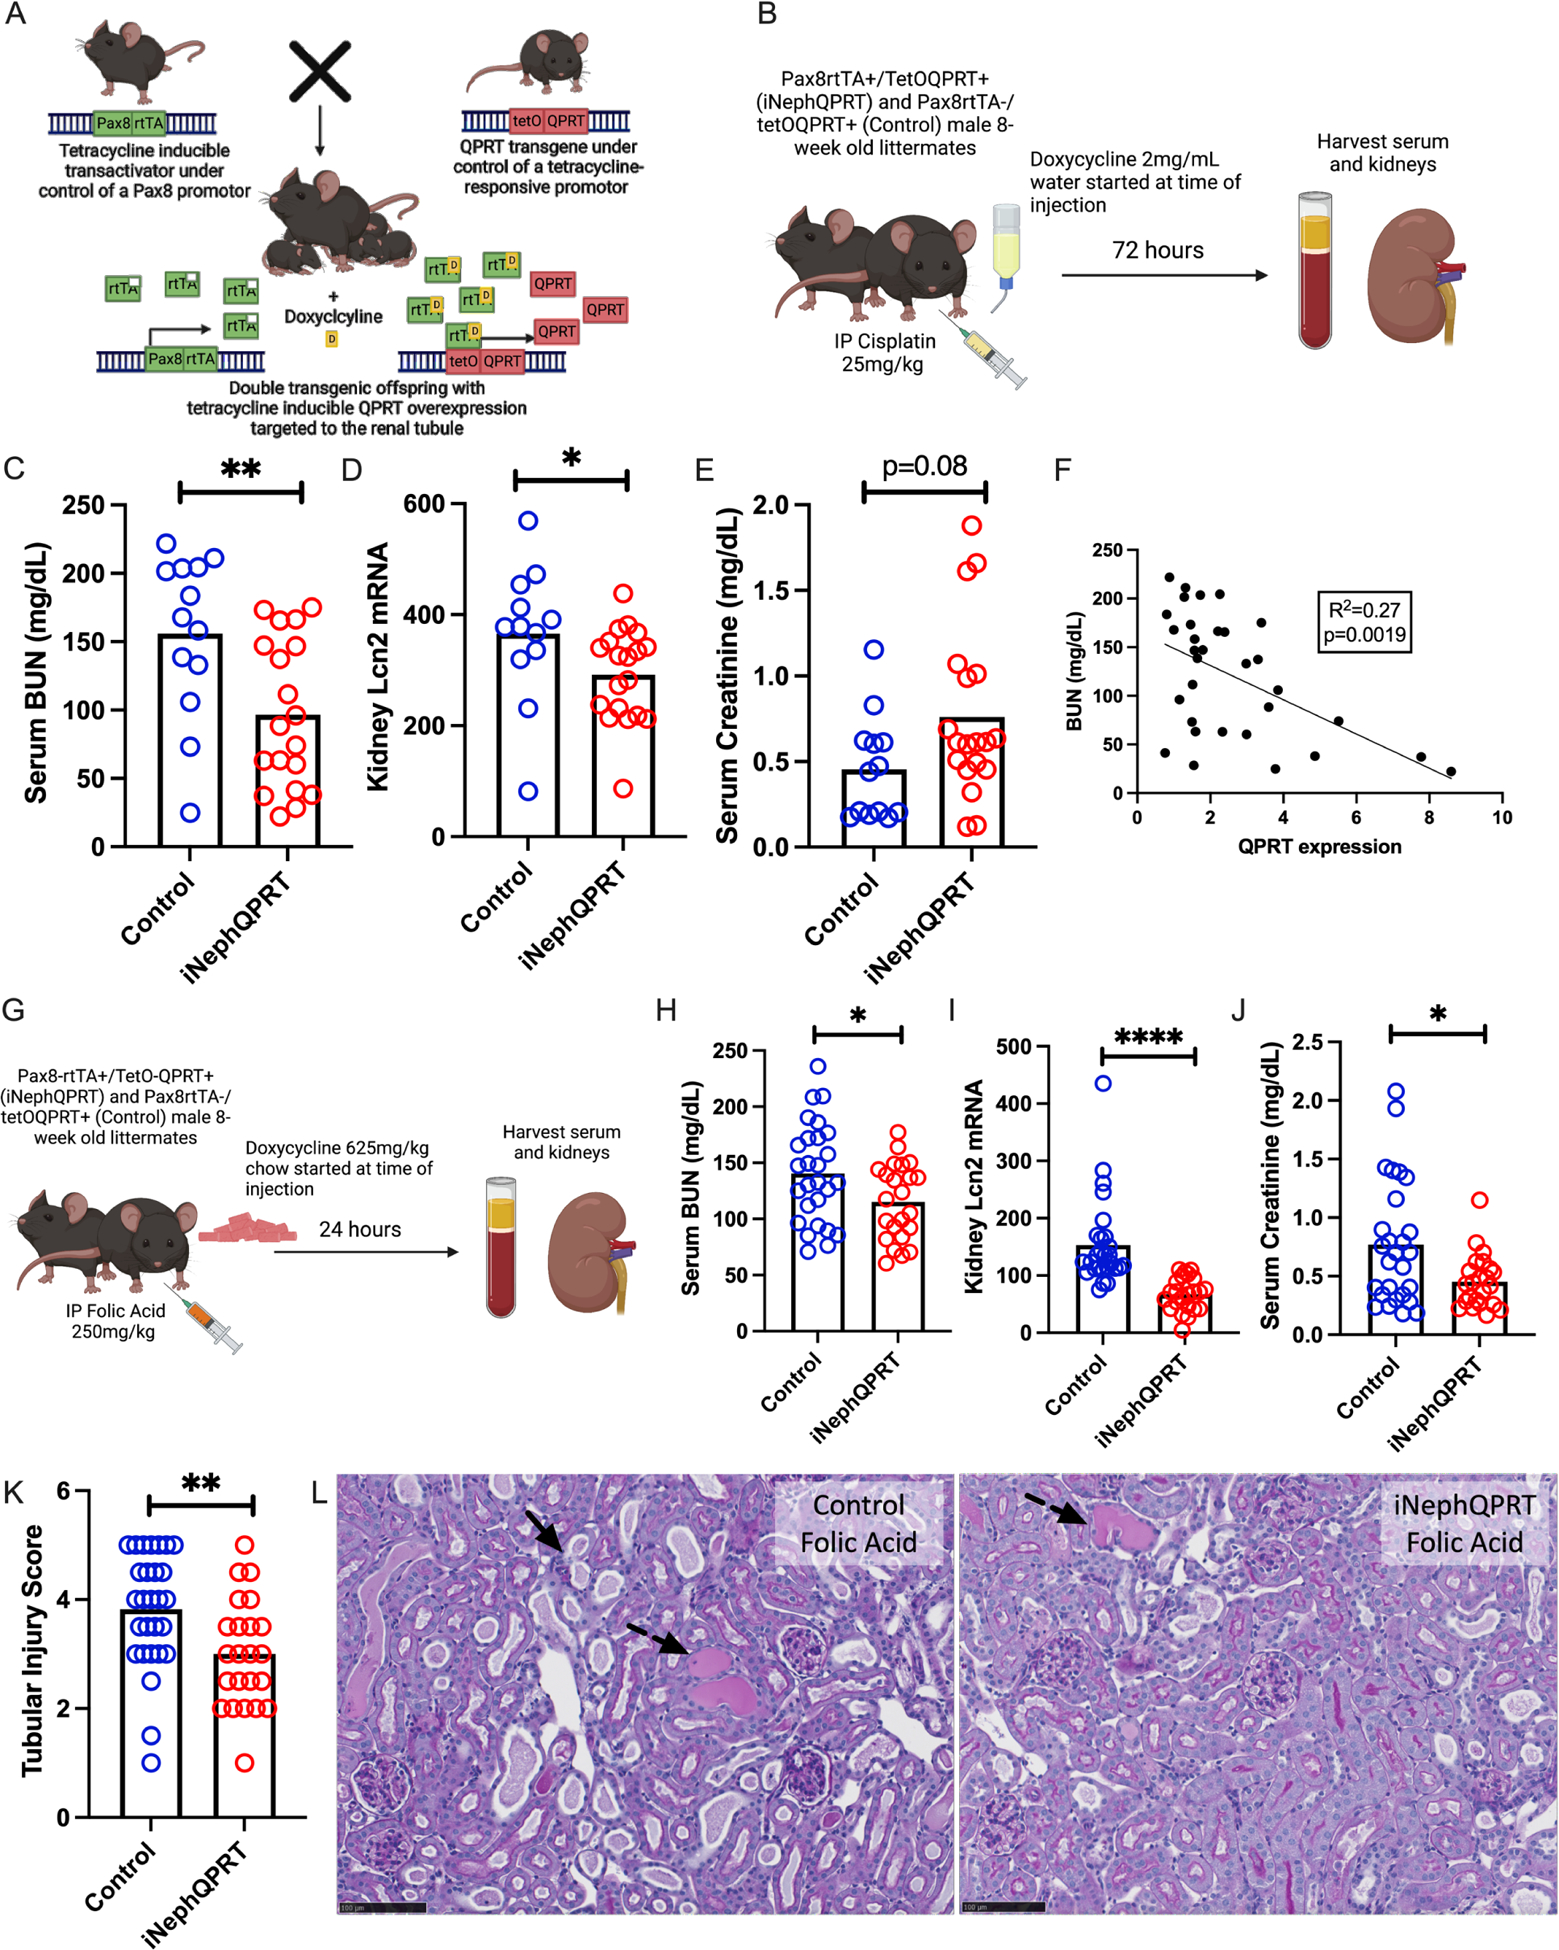
Figure 4: iNephQPRT mice are protected against two distinct models of nephrotoxic AKI.

a. Schema of iNephQPRT mouse generation. b. Schema of iNephQPRT cisplatin experiment. c. Serum BUN, renal lcn2 mRNA (d), and serum creatinine (e) in iNephQPRT (n=19) and control (n=13) littermates after cisplatin (72 hours after cisplatin 25mg/kg IP). f. Correlation of serum BUN with QPRT mRNA expression. g. Schema of folic acid experiment. Serum BUN (h), renal lcn2 mRNA (i), serum creatinine (j), and tubular injury scoring after folic acid (24 hours after 250mg/kg IP) (k) in iNeph QPRT mice (n=23) and control littermates (n=27). l. Representative histology after folic acid iNephQPRT mice and controls. Dotted arrows represent dilated tubules with intratubular casts. Solid arrows represent necrotic cells and denuded tubules. Black scale bars represent 100um.* = p<0.05, ** = p<0.01, *** = p<0.001, **** = p<0.0001.
