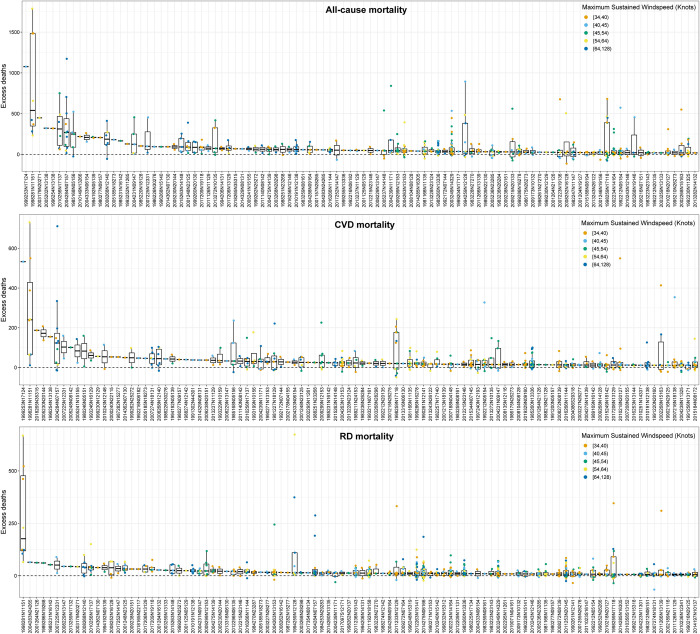
Fig 2. The top 100 TCs with highest excess deaths from all-cause, CVDs, and RDs.
Each point in the figure indicates a location, and each tick on the X-axis represents a TC, which is identified by its IBTrACS event ID. A boxplot was fitted for the location-specific TC-related excess deaths within each TC. Each box represents the IQR of the excess deaths of each TC, with the middle bolded black line in the box representing the median value. The whiskers extending from the box indicate a range of 1.5 times the IQR. CVD, cardiovascular disease; IQR, interquartile range; RD, respiratory disease; TC, tropical cyclone.

