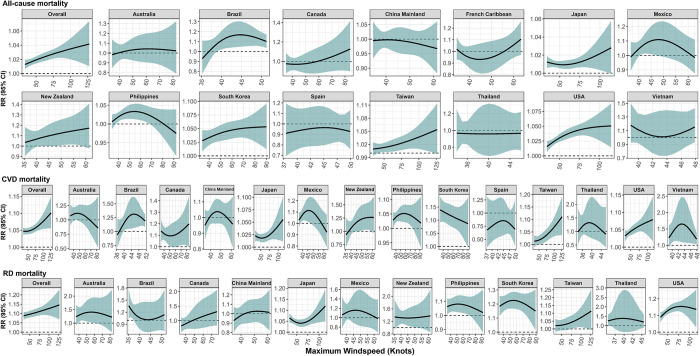
Fig 5. The exposure-response relationship of the RR for all-cause, CVDs, and RDs mortality with TC-related maximum sustained windspeed (knots) by countries or territories.
The RRs indicated the mortality risks in TC days compared to non-TC days. CVD, cardiovascular disease; RD, respiratory disease; RR, relative risk; TC, tropical cyclone.

