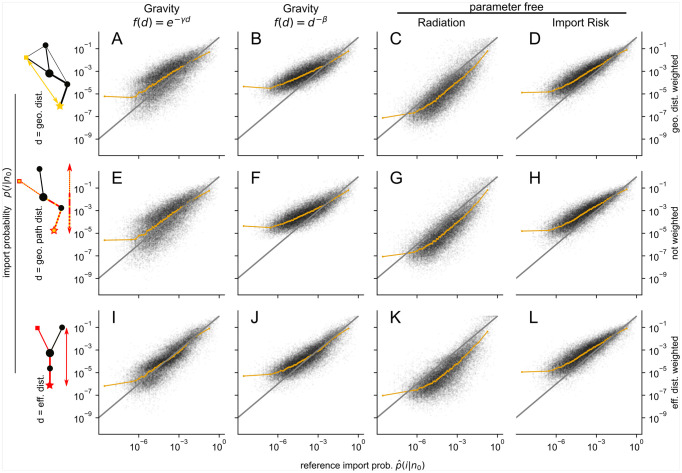
Fig 3. Estimates of import probability by the gravity model with exponentially (1st column) and power law (2nd column) decaying distance function, the radiation model (3rd. column) and by the import risk model (4th column).
The first three models (1st-3rd column) use as distance the geodesic (1st row), geodesic path (2nd row) and the effective (3rd row) distance. The import risk model is computed from the WAN with the geodesic distance (D) or the effective distance (L) as a weight for the exit probabilities or without weighting (H), i.e. in the last two cases (H, D) only WAN information is used. The orange line depicts the median and the gray line is y = x and illustrates perfect mapping.

