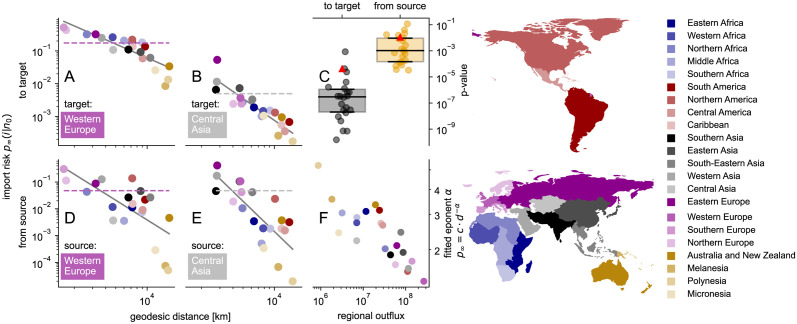
Fig 8. Import risk aggregated on regional level “to target” vs. “from source” and its geodesic distance dependence.
The geodesic distance between regions predicts the import risk p∞ to a single target from all sources (A, B) better than from a single source to all targets (D, E) as can be seen by the p-values (C) of the power law fit p∞(d) = c⋅d−α that is illustrated for each selected examples by a grey line (A, B, D, E). The fitted exponent α of the import risk to a single target decreases with the respective regional WAN flow out of the target region (F), i.e. the more connected a region, the weaker the import risk decays with distance. The dashed horizontal lines show the average import risk of a single target (A, B) or a single source (D, E). The color of the dots corresponds to the depicted world regions (right). Maps are created with geopandas [48].

