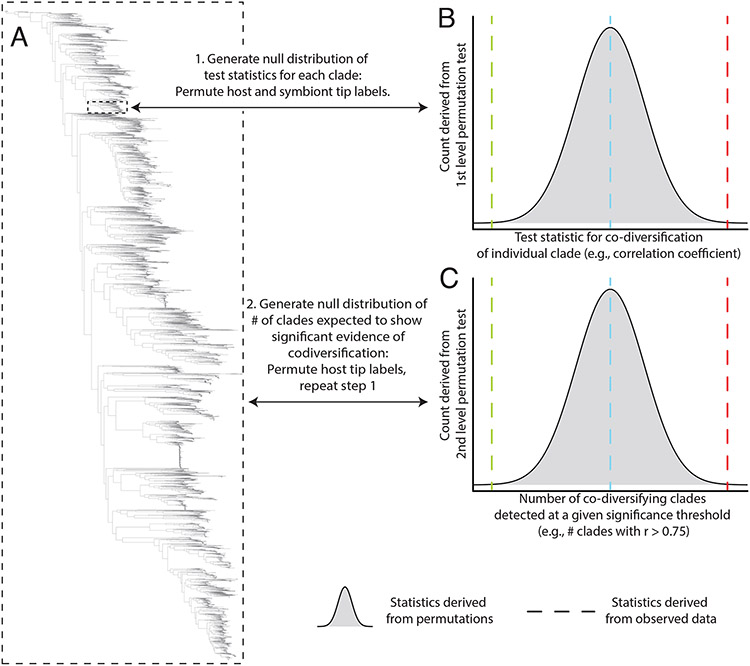
Fig. 2. Multi-level permutation tests enable quantification of co-diversification in complex microbiota.
(A) Phylogeny shows hypothetical relationships among symbionts recovered from a clade of hosts. Scans for co-diversification can be conducted on each node of the symbiont phylogeny (smaller dashed box). Aggregating the statistics of these tests across all or many nodes in the symbiont phylogeny (larger dashed box) can reveal whether the symbiont phylogeny more instances of significant evidence for co-diversification across symbiont clades than expected under the null hypothesis of no co-diversification. (B) Histogram shows the distribution of test statistics for co-diversification derived from permutation tests of host and symbiont tip labels for an individual symbiont clade, corresponding to the smaller dashed box in (A). Vertical dashed lines indicate hypothetical test statistics observed from real data from the clade, with red indicating significant evidence for co-diversification in the clade, blue indicating no evidence for co-diversification, and green indicating negative association between host and symbiont phylogenies. (C) Histogram shows the null distribution of the number of co-diversifying clades detected at a given significance threshold from phylogeny-wide scans for co-diversification conducted after random permutations of the host phylogeny’s tip labels. Vertical dashed lines indicate hypothetical numbers of significantly co-diversifying clades observed in the real dataset, with red indicating more instances of significant co-diversification than expected by chance under the null hypothesis of no co-diversification. As in (B), blue or green dashed lines indicate no evidence for co-diversification across the symbiont phylogeny or significantly fewer instances of co-diversification than expected under the null hypothesis, respectively.

