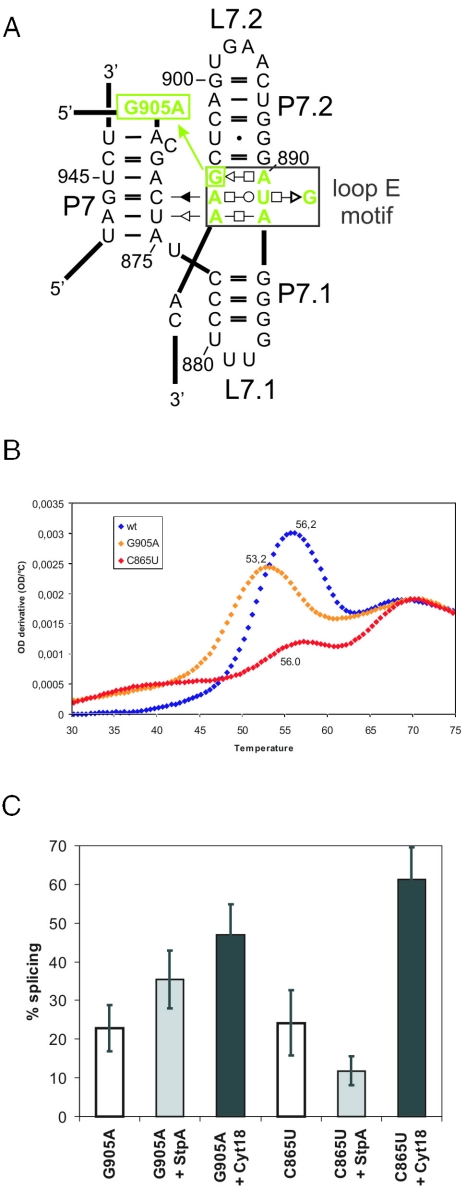
Figure 4.
Splicing of a loop E mutant is increased in the presence of StpA. (A) Schematic representation of the loop E motif using the base pair annotation described in (50). The loop E mutant G905A is indicated. (B) First derivative of a UV absorbance profile for melting of RNA tertiary and secondary structures due to increasing temperature is shown for wild-type td intron (in blue), the tdG905A mutant in the loop E motif (in yellow) and the tdC865U mutant in P6 (in red). (C) Splicing of the loop E mutants tdG905A and tdC865U in the absence and presence of StpA and Cyt-18, respectively. Quantification of four independent experiments.

