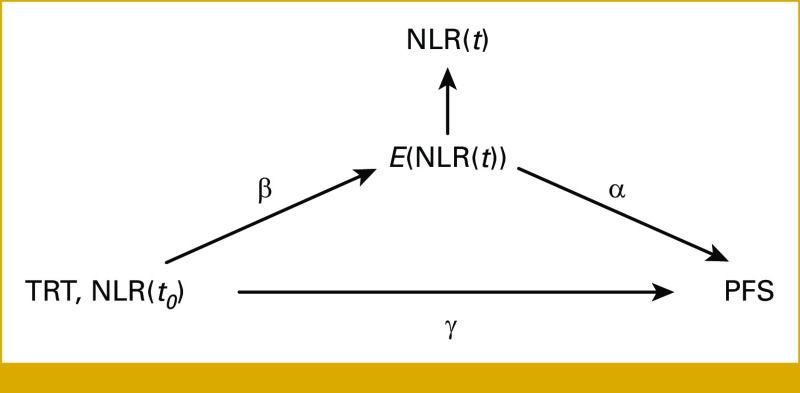
FIG 1.
Causal graph of the joint model. TRT denotes treatment, NLR(t0) baseline biomarker value, NLR(t) current biomarker value, E(NLR(t)) trajectory function, and PFS time-to-event outcome. The regression coefficients are denoted by α, β, and γ. NLR, neutrophil-to-lymphocyte ratio; PFS, progression-free survival.

