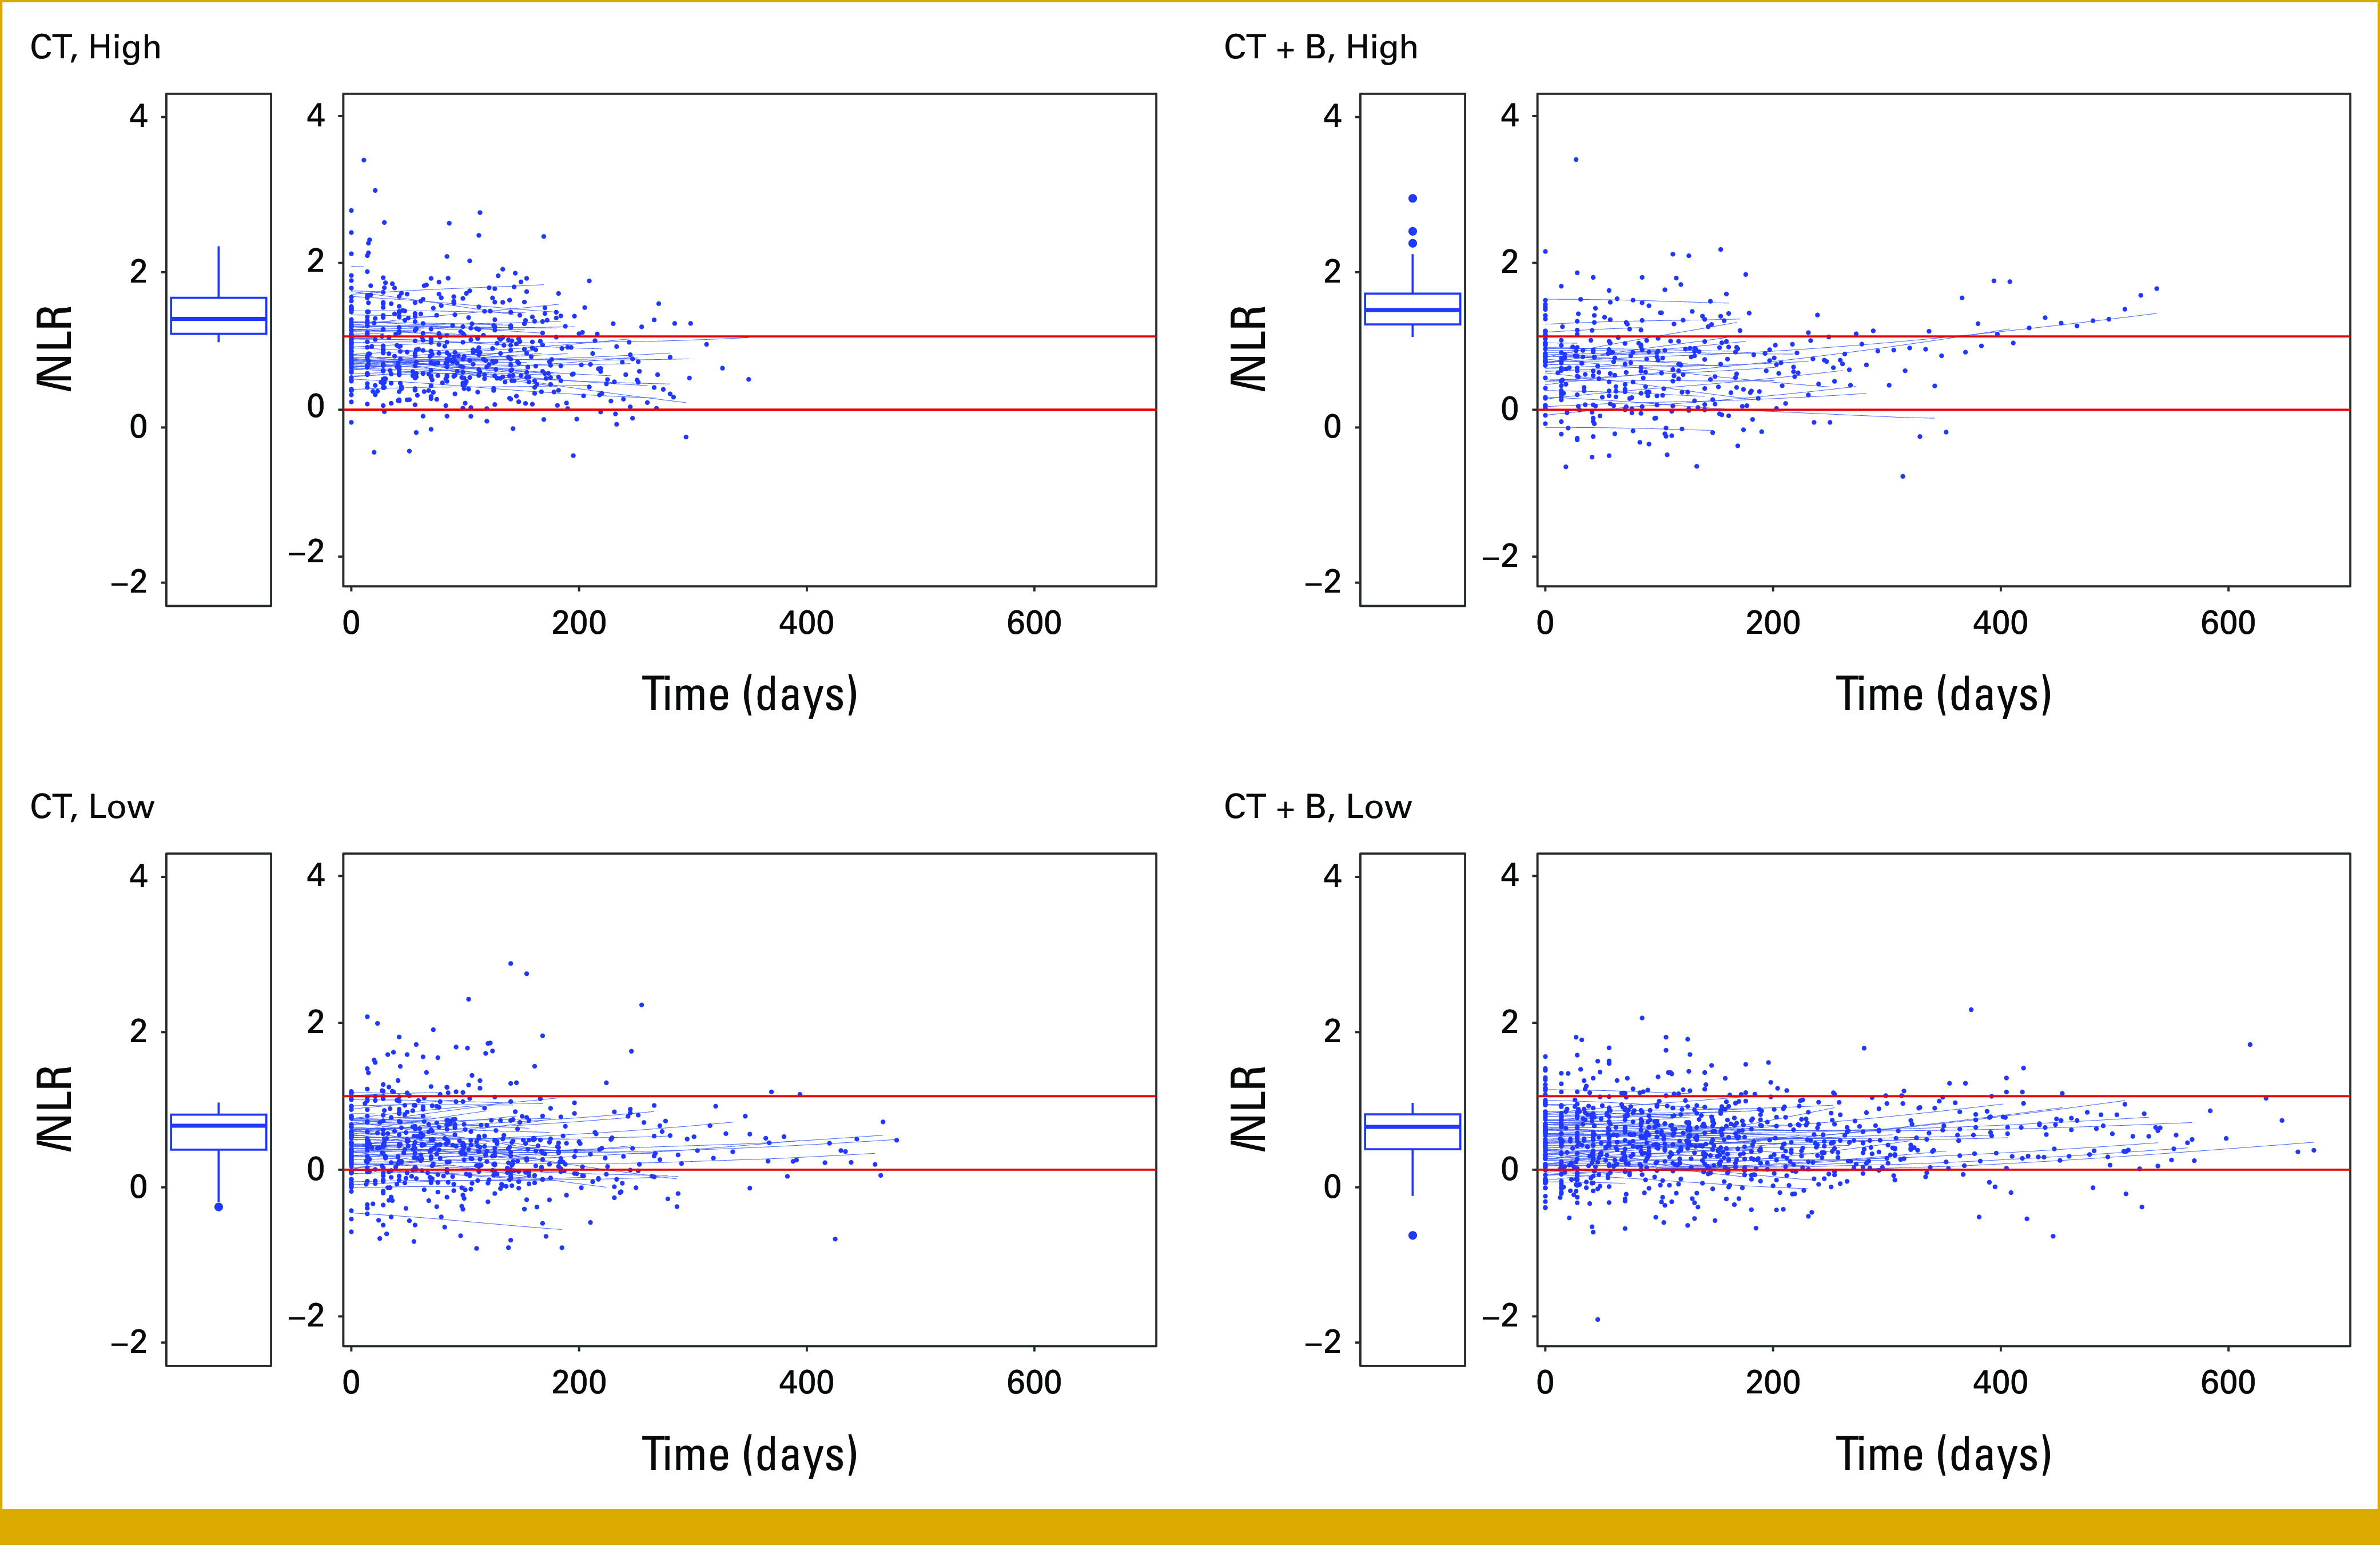
FIG 2.

Observed values and predicted individual trajectories for lNLR over time from the mixed random-effects model excluding the baseline lNLR values by treatment arm and baseline lNLR value (low: lNLR <1.10; high: ≥1.10). Here, time equals to zero corresponds to the first postbaseline time point available for each patient. Boxplots refer to lNLR values at baseline in each group of patients. CT, chemotherapy; CT + B, chemotherapy + bevacizumab; NLR, neutrophil-to-lymphocyte ratio.
