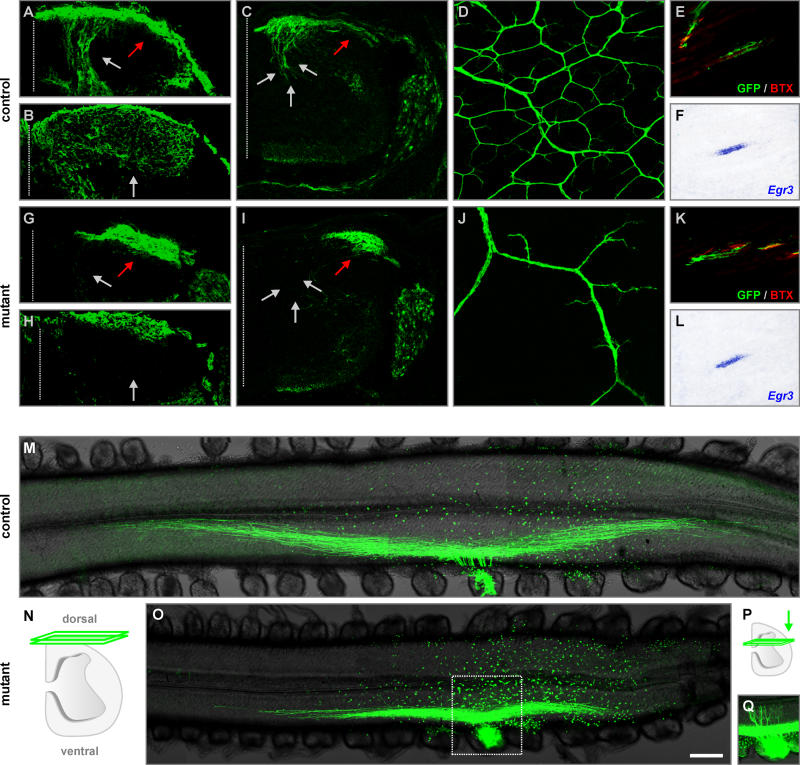
Figure 3. Defects in the Establishment of Sensory Afferent Projections upon Precocious Expression of EWS-Pea3 in DRG Neurons.
(A–C and G–I) Visualization of sensory afferent projections (green) into the spinal cord of wild-type (A–C) and TauEWS-Pea3/+ Isl1Cre/+ (G–I) embryos at E13.5 (A, C, G, and I) and E16.5 (B and H) by Cre-recombinase-mediated activation of mGFP expression from the Tau locus (A, B, G, and H) or by a Thy1spGFP transgene (C and I; [25]). Grey arrows indicate normal pattern of afferent projections into the spinal cord, whereas red arrows show aberrant accumulation of sensory afferents at the lateral edge of the spinal cord in TauEWS-Pea3/+ Isl1Cre/+ embryos.
(D–F and J–L) Analysis of sensory afferent projections (green) into the skin (D and J) or muscle (E and K; red, α-Bungarotoxin, BTX) of wild-type (D–F) and TauEWS-Pea3/+ Isl1Cre/+ (J–L) embryos at E16.5 by Cre-recombinase-mediated activation of mGFP (D, E, J, and K) expression from the Tau locus. (F and L) show Egr3 expression in intrafusal muscle fibers using in situ hybridization (consecutive sections to [E and K] are shown).
(M–Q) Analysis of bifurcation of sensory afferent projections towards the spinal cord in E13.5 wild-type (M) and TauEWS-Pea3/+ Isl1Cre/+ (O and Q) embryos after injection of fluorescently labeled dextran (green) into one DRG (lumbar level L3). Confocal scanning plane for (M and O) is schematically illustrated in (N). Inset in (O) is also shown at a deeper confocal scanning plane (P and Q) to visualize aberrant axonal projections.
Scale bar: (A and G), 60 μm; (B and H), 80 μm; (C and I), 100 μm; (D and J), 160 μm; (E, F, K, and L), 70 μm; (M, O, and Q), 240 μm.

