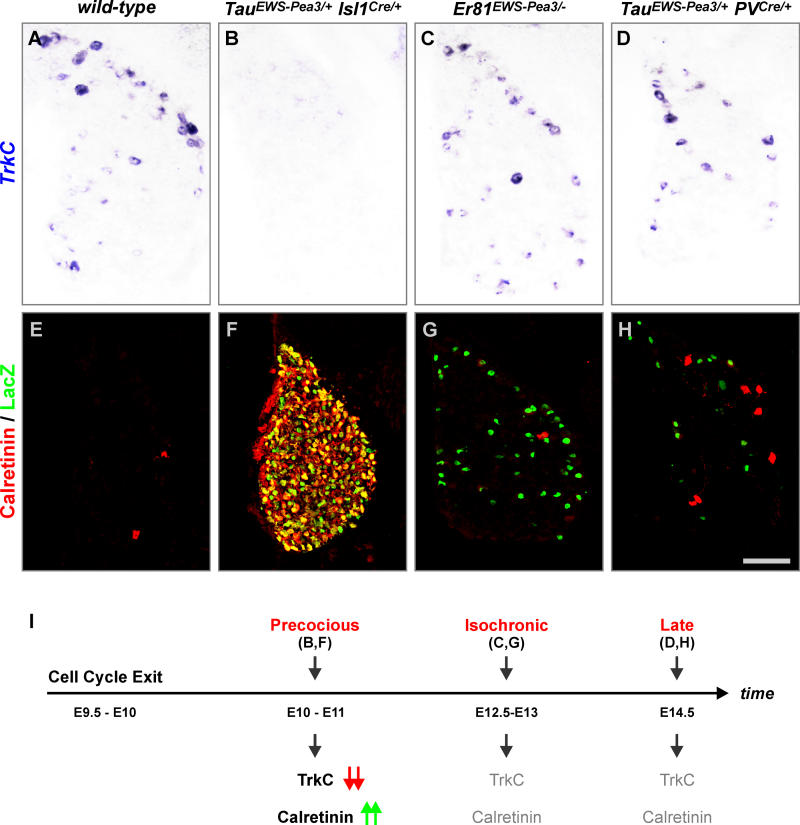
Figure 7. Gene Expression Analysis upon Induction of Precocious or Isochronic ETS Signaling.
(A–H) Analysis of TrkC expression by in situ hybridization (A–D), or Calretinin (red) and LacZ (green) expression by immunohistochemistry (E–H), on E16.5 lumbar DRG of wild-type (A and E), TauEWS-Pea3/+ Isl1Cre/+ (B and F), Er81EWS-Pea3/− (C and G), and TauEWS-Pea3/+ PVCre/+ (D and H) embryos.
(I) Summary diagram illustrating deregulation of TrkC (red arrows, downregulation) and Calretinin (green arrows, upregulation) expression upon precocious (B and F) induction of EWS-Pea3 expression in DRG neurons (B and F; E10–E11, i.e., shortly after cell cycle exit, E9.5–E10). In contrast, activation of EWS-Pea3 from the endogenous Er81 locus (C and G; E12.5–E13) or via Cre recombinase expression from the PV locus activating late expression from the Tau locus (D and H; E14.5) does not interfere with the normal expression of TrkC and Calretinin (shown in grey).
Scale bar: (A–D), 65 μm; (E–H), 80 μm.

