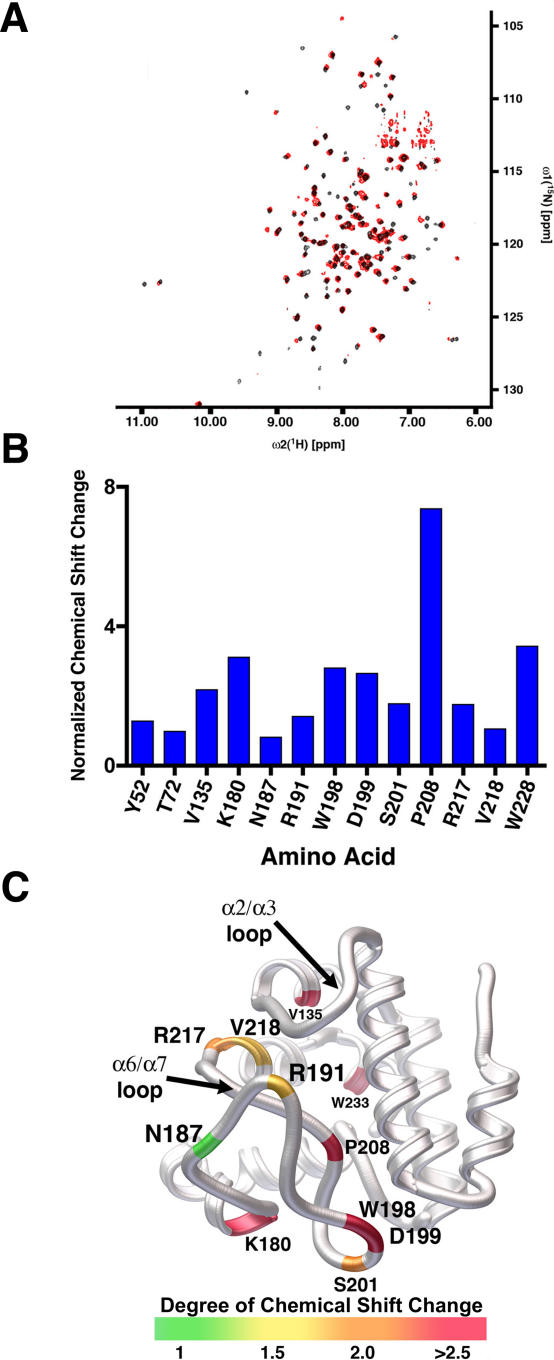
Figure 4. Analysis of SynGUN4 by NMR.
(A) Comparison of spectra obtained from 1H-15N TROSY experiments of SynGUN4 in the absence (black) and presence (red) of 2 mM deuteroporphyrin.
(B) Normalized chemical shifts for those 1H-15N cross peaks whose positions change in the presence of 2 mM deuteroporphyrin. In general, the largest shifts cluster for residues on the α6/α7 loop. The remaining positions with significant chemical shifts reside on the “greasy palm” region of SynGUN4.
(C) Rendered ribbon diagram of the Gun4 core domain with the position of the shifting 1H-15N cross peaks mapped onto the backbone structure of SynGUN4. The magnitude of the chemical shift changes shown corresponds to the color bar at the bottom. Briefly, shifts larger than 2.5 parts per million (ppm) are shown in red, shifts between 2 and 2.5 ppm are shown in orange, shifts between 1.5 and 2 ppm are shown in yellow, and shifts of 1.5 ppm and less are shown in green.

