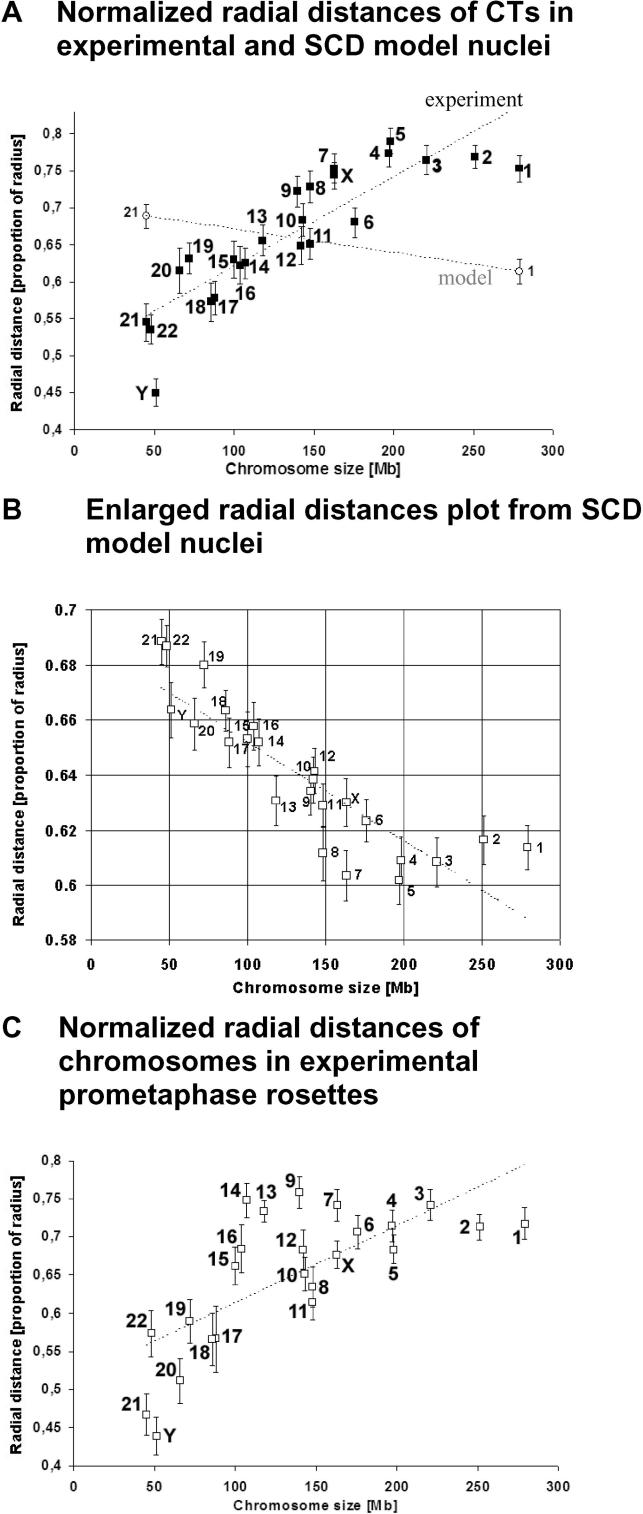
Figure 3. Normalized Radial Chromosome Distances in G0 Fibroblast Nuclei, SCD Model Nuclei, and Prometaphase Rosettes.
(A) Normalized 3D radial CN–CT distances (filled squares) show a positive correlation with chromosome size (indicated by DNA content): CTs of small chromosomes were preferentially located in the center of the nucleus, whereas CTs of large chromosomes were found more often at the nuclear periphery. Open circles 1 and 21 indicate the endpoints of SCD model data simulating a statistical placement of CTs.
(B) SCD model data indicate that geometrical constraints result in a reverse pattern of CT distributions, i.e., modeled small CTs show a significantly higher probability of being localized at the nuclear periphery, while modeled large CTs adopt a more internal localization.
(C) In agreement with normalized 3D CN–CT distances, normalized 3D CR–PC distances also show a positive correlation with the DNA content or size of chromosomes: small PCs were preferentially located near the CR, large chromosomes at the rosette periphery.

