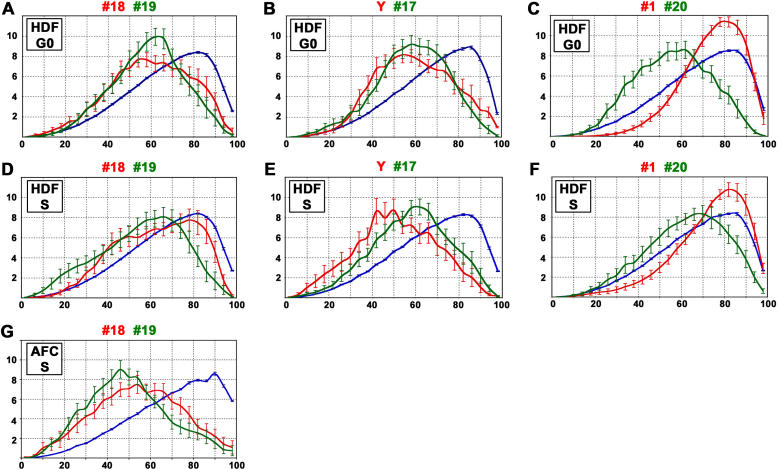
Figure 6. Comparison of Radial CT Positions in Quiescent and Proliferating Cell Nuclei.
The abscissa shows the radial 3D distribution of CT-specific and whole-DNA-specific voxels in 25 concentric nuclear shells. The origin represents the center of the nucleus, and “100” represents the nuclear border. The ordinate indicates the mean frequency of the intensity-weighted voxels above threshold in each shell (in percent). Example images are shown in Figure S8. Bars correspond to standard errors of the mean.
(A–F) A semi-confluent human diploid fibroblast (HDF) culture containing both quiescent cells (G0) and proliferating cells was used for two-color 3D FISH with different pairs of chromosome paint probes. In each experiment light-optical serial sections were recorded from 20 G0 nuclei (A–C) and 20 nuclei at early S-phase (D–F). All voxels attributed to a segmented CT were used to describe its radial position (red and green curves). Blue curves show the voxel-based radial distribution of whole DNA stained with TOPRO-3. Comparison of (A and D) gene-poor HSA 18 (red curve) and gene-rich HSA 19 (green curve), (B and E) gene-poor HSA Y (red curve) and gene-rich HSA 17 (green curve), and (C and F) large HSA 1 (red curve) and small HSA 20 (green curve). Irrespective of their gene content the small HSAs 17, 18, 19, 20, and Y were all located significantly closer towards the nuclear interior compared to the distribution of the whole nuclear DNA (p < 0.05, two-tailed K-S test). The difference between the radial location of pair HSA 18/19 CTs both in quiescent and cycling cell nuclei, however, was not significant. For the pair HSA 17/Y, no significant difference was obtained between G0 and S-phase nuclei (p > 0.05, Students t-test [t-test]). In contrast, HSA 1 was significantly shifted towards the nuclear border compared to HSA 20 (p < 0.001, t-test), although HSAs 1 and 20 have a similar overall gene density.
(G) Comparison of HSA 18 (red curve) and HSA 19 (green curve) in nuclei of proliferating amniotic fluid cells during S-phase (n = 18). Although there is a slight excess of CT 19 voxels towards the nuclear interior compared to CT 18 voxels, the two curves are not significantly different (p > 0.05; t-test).

