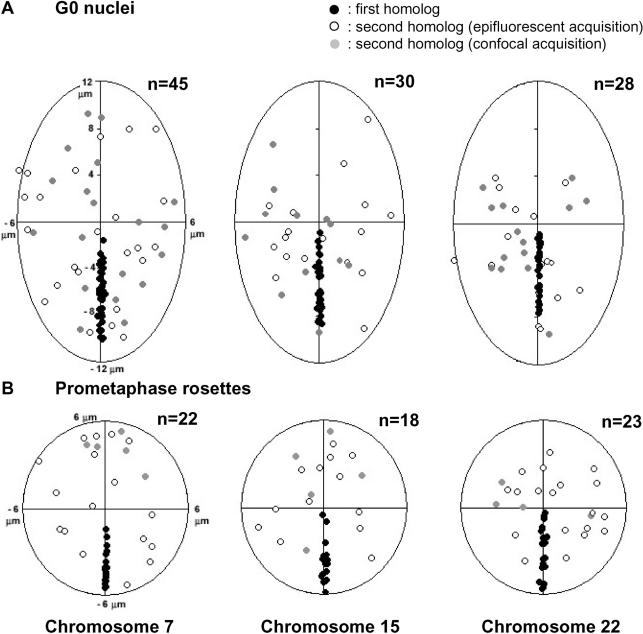
Figure 8. Relative Spatial Distributions of Homologous Chromosomes of HSAs 7, 15, and 22.
Schematic outlines of fibroblast nuclei (as ellipses, A) and prometaphase rosettes (as circles, B) with normalized size and shape. The IGC of one randomly selected homolog was placed along the negative long axis. The IGC of the other homolog was marked at the corresponding nuclear position. Gray dots represent data obtained by confocal microscopy, open circles by wide-field microscopy. Angle measurements for all pairs of homologous chromosomes are presented in Figure S9 for G0 nuclei and in Figure S10 for rosettes.

