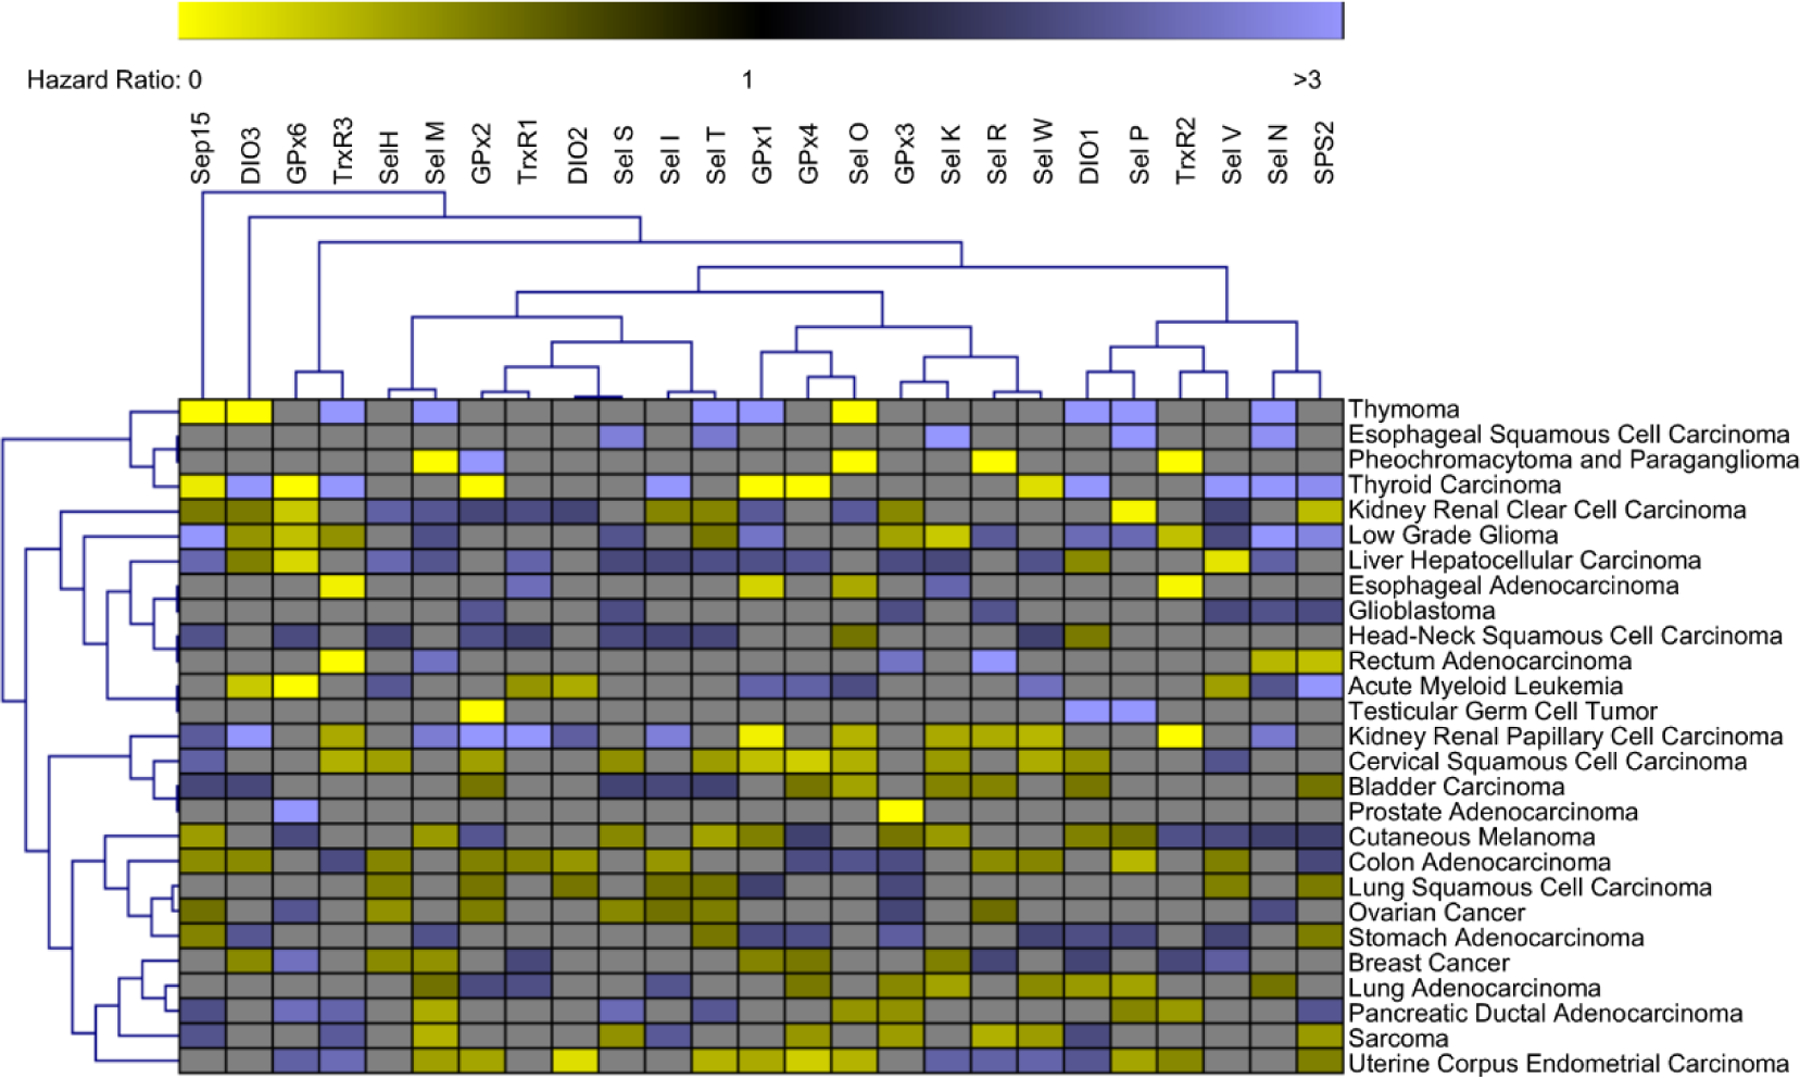
Figure 5. Key figure. Hazard ratios of selenoproteins across cancer types.

Unbiased hierarchal clustering was used for visualization of statistically significant (p<0.05) selenoprotein hazard ratios across various cancers with branches representing statistically similar groupings of genes or cancers. A hazard ratio of 1 indicates no difference between groups (high vs low expression of selected gene). Hazard ratios >1 (Blue) indicates correlation between higher expression and lower survival of the indicated gene. Hazard ratios <1 (Yellow) indicates correlation between lower expression and higher survival of the indicated gene. Hazard ratios with nonsignificant correlations (p>0.05) were not included in the analysis and are represented as gray boxes. Several cancers such as liver hepatocellular carcinoma, glioblastoma, and head-neck squamous cell carcinoma have multiple selenoprotein hazard ratios > 1 indicating that efforts to reduce selenoprotein expression may provide therapeutic benefit. Other cancers such as cervical squamous cell carcinoma and uterine corpus endometrial carcinoma have multiple selenoprotein hazard ratios < 1 indicating that efforts to boost selenoprotein expression may provide therapeutic benefit. However, throughout the analysis of 25 selenoproteins across 27 cancers the only cancer with a net positive or negative survival correlation with selenoprotein expression is glioblastoma. Furthermore, many selenoproteins have significant and opposite correlations with patient survival across different cancer types. This data highlights the complexity and context dependent role of selenoproteins across different cancer types.
