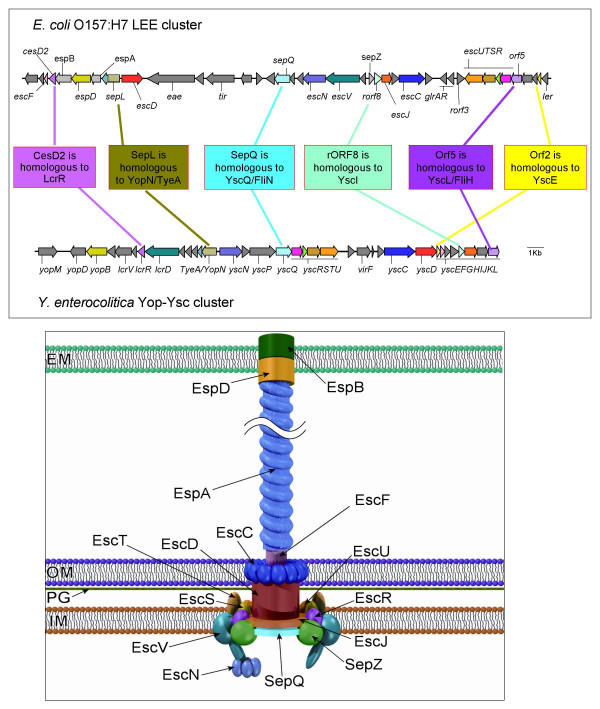
Figure 1.
1a: A comparison between the E. coli O157:H7 LEE and the Yersinia enterocolitica Yop-Ysc clusters. 1b: Graphical representation of the LEE-encoded type-III secretion system. The LEE region between EspF and Ler is shown (4589000–4620000 of the E. coli O157:H7 RIMD 0509952 genome. Accession number: dbj|BA000007.2). The Yop-Ysc cluster between YopM and YscL is shown (15000–40000 of the Yersinia enterocolitica plasmid pYVe227 Accession number: dbj|BA000007.2gb|AF102990). Genes shaded in the same solid colour exhibit previously known homologies between the LEE and Ysc/Yop cluster. Genes shaded in the same colour but with horizontal hatching are homologues where we have added information in this paper. Genes which show no apparent homology to any the Ysc/Yop system, but which encode proteins that appear in our graphical representation are shaded with grey/white diagonal hatching (espB, espA, sepZ). Uncharacterized genes where there is no homology, and where their gene products do not appear in our cartoon are shaded solid grey. In the cartoon of the LEE-encoded type-III secretion system proteins are shaded in the same colour as their corresponding genes in the map of the gene cluster. Model based on the type III secretion model from KEGG http://www.genome.jp/kegg/pathway/map/map03070.html, and additional published data and images [70, 73, 145, 156, 157]. IM, inner membrane; PG, peptidoglycan layer; OM, outer membrane; EM, eukaryotic membrane.

