
FIGURE 2.
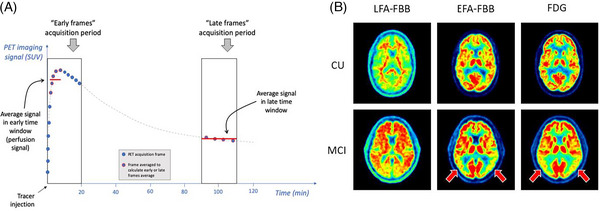
A, Cartoon illustrating the concept of early frames and late frames PET acquisition, for a theoretical time‐activity curve from one region of interest (gray dashed line). Both early and late frame signals are most simply summarized by calculating the average over a given time window, and conventionally expressed as the standardized uptake value ratio (SUVR) by dividing the average value in each voxel or region of interest by the average value in a reference region. Of note, the reference region may be different for early (perfusion) and late (amyloid) frames analyses. The time windows illustrated here correspond to those used in ADNI 3 sub‐study for 18F‐florbetaben. B, Illustrative examples of LFA and EFA perfusion maps from one CU and one MCI participant scanned with FBB, compared to 18F‐FDG PET scans from the same individuals, from the ADNI 3 sub‐study. These examples illustrate similar EFA (perfusion) and [18F]‐FDG (glucose metabolism) profiles in the same participants, including pronounced temporoparietal hypoperfusion and hypometabolism in the MCI case (red arrows). In contrast, the LFA scans reflect amyloid burden and show greater cortical signal in the MCI participant. ADNI, Alzheimer's Disease Neuroimaging Initiative; CU, cognitively unimpaired; EFA, early frames amyloid; FBB, 18F‐florbetaben; FDG, fluorodeoxyglucose; LFA, late frames amyloid; MCI, mild cognitive impairment; PET, positron emission tomography.