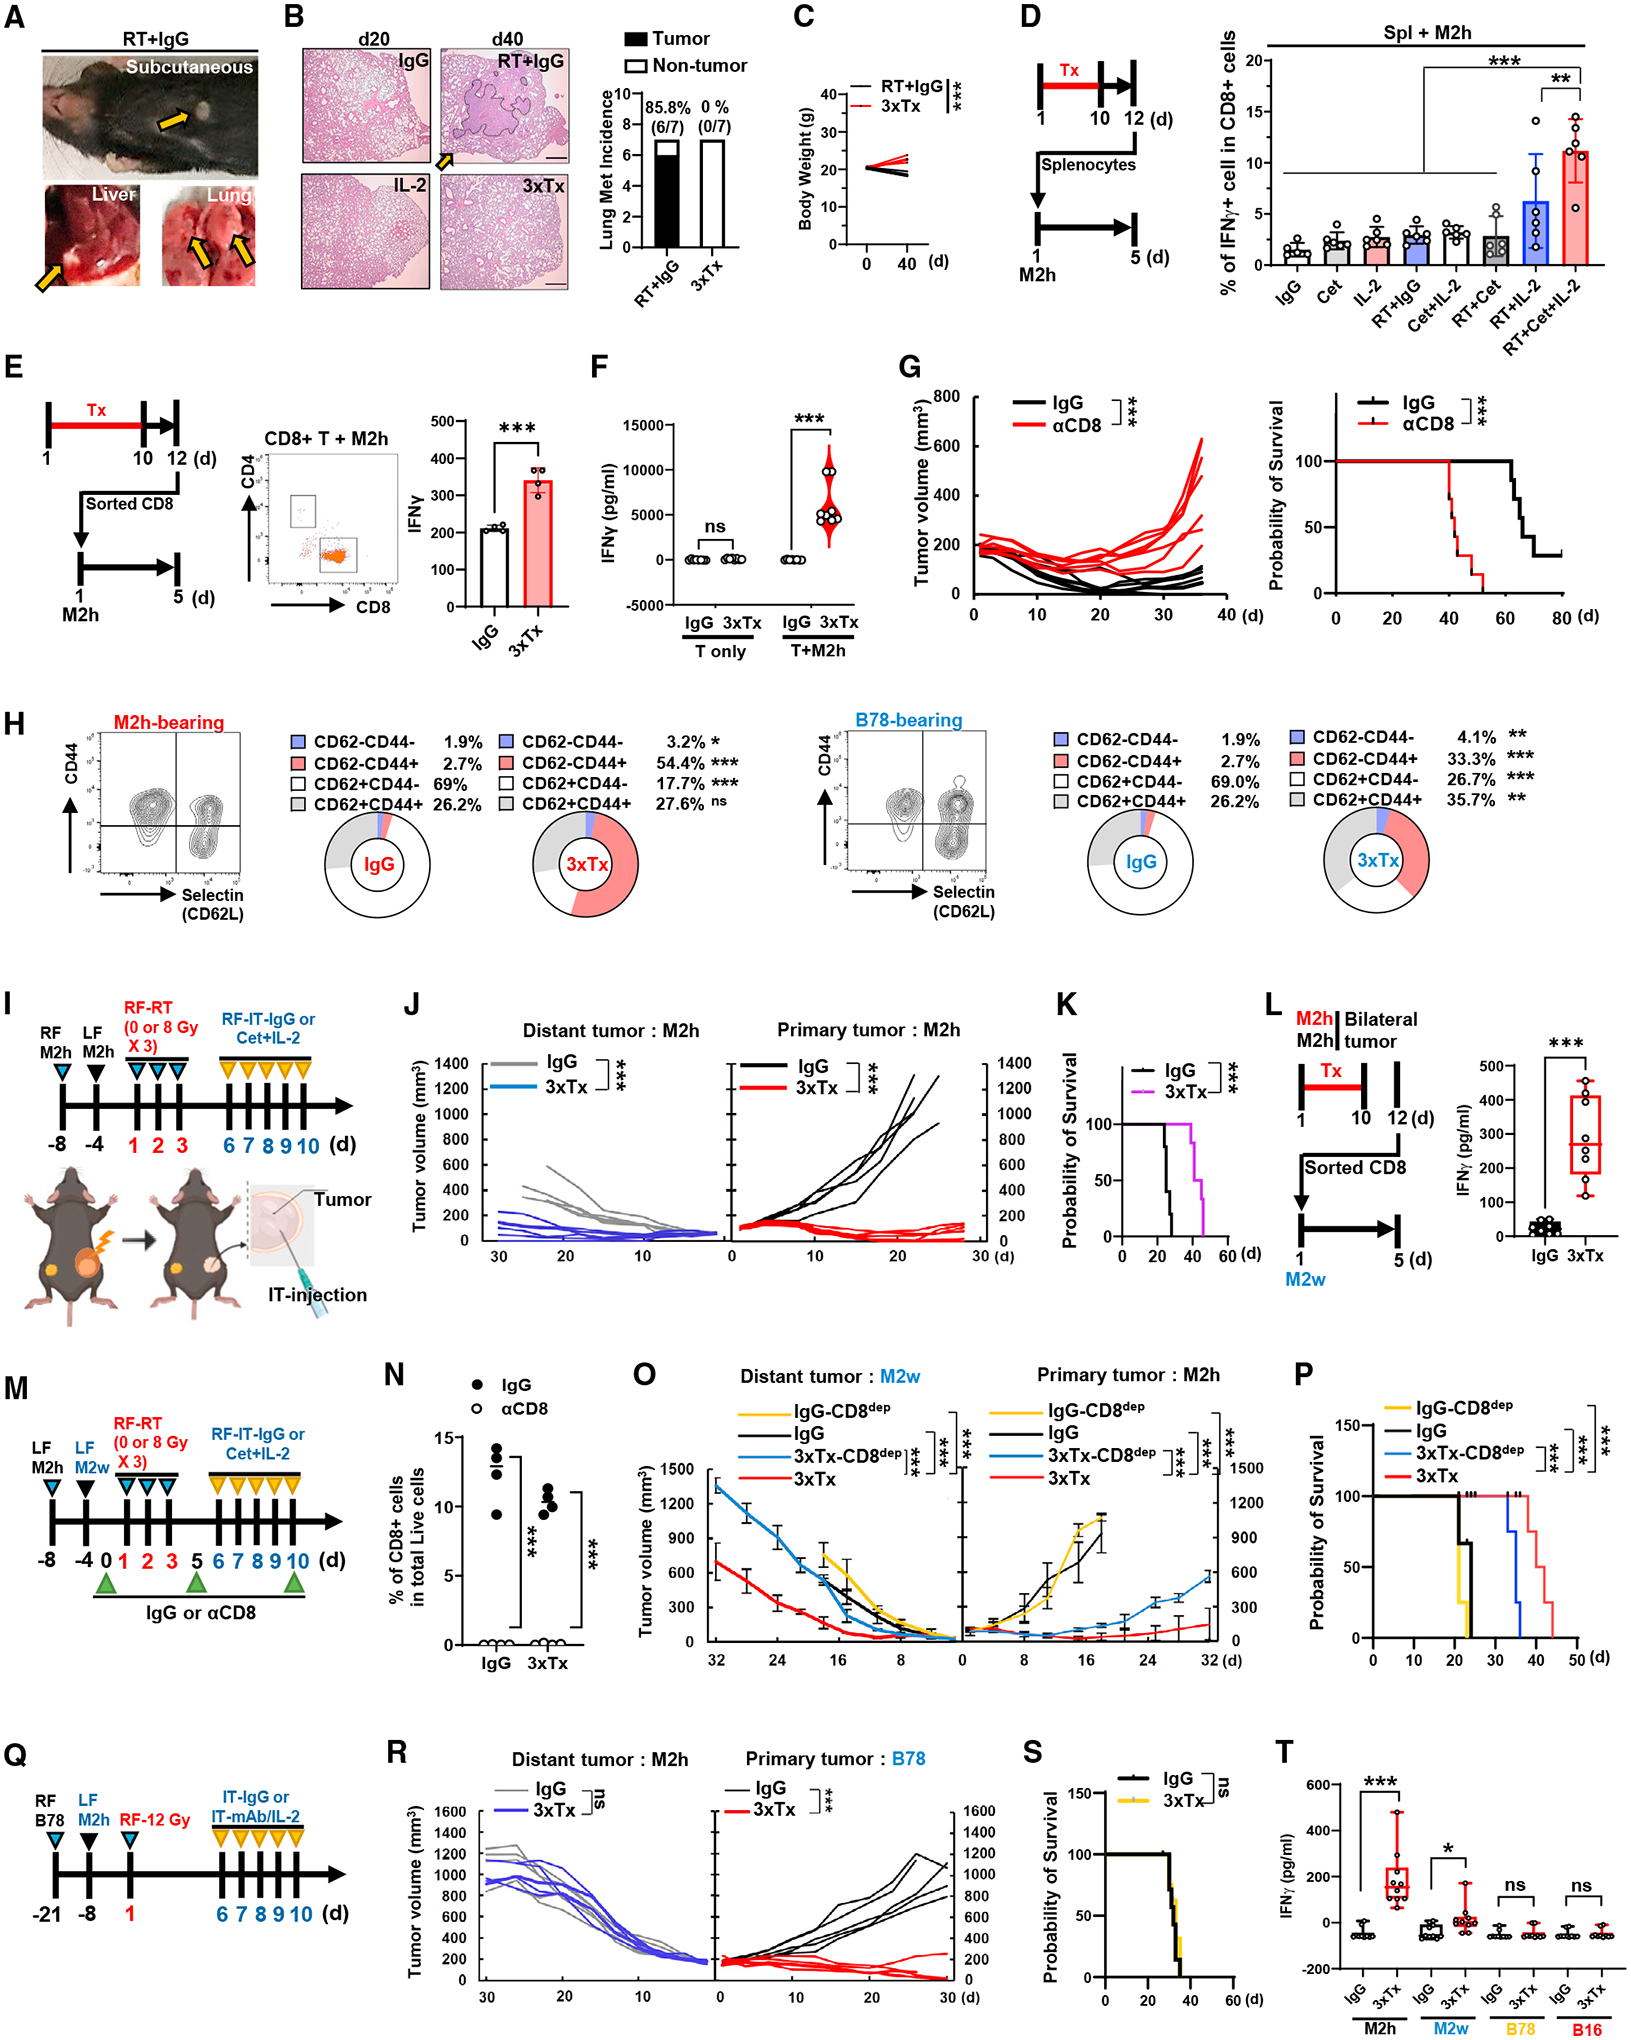
Figure 3. 3xTx activates CD8+ T cell immunity to achieve an in situ vaccine effect.

(A and B) Mice with an M2h flank tumor were treated as in Figure 2H. (A) Visible tumor metastases at day 40. (B) H&E staining of lung tissue (left) and quantification of lung metastases (right). Scale bar, 200 μm (n = 7). The orange arrows indicate tumors.
(C) Total body weight (n = 5).
(D–F) Spleens or spleen-sorted CD8+ T cells from M2h-bearing mice were collected and co-cultured with M2h for 5 days. (D) Quantification of IFN-γ+ cells in splenic CD8+ cells (n = 5–6). (E) Analysis of IFN-γ mean fluorescence intensity (MFI) in sorted CD8+ cells (n = 4). (F) Secreted IFN-γ from sorted CD8+ cells co-cultured with or without M2h (n = 4–8).
(G) Individual tumor volume (left) and survival data (right) from 3xTx-treated M2h-bearing mice that received IgG or anti-CD8a antibody (n = 7).
(H) CD8+ T cell subset in PBMCs collected from M2h- or B78-bearing mice after treatment (n = 3).
(I–L) Bilateral-tumor-bearing mice received 3xTx or IgG on the primary tumor. (I) Treatment regimen. (J) Individual tumor volume and (K) survival data (n = 5). (L) Secreted IFN-γ from co-cultured spleen-sorted CD8+ T cells and M2w (n = 8).
(M–P) Bilateral-tumor-bearing mice (M2h and M2w) received IgG or 3xTx on the primary tumor with IgG or anti-CD8a antibody (CD8dep). (M) Treatment regimen. (N) CD8+ T cell depletion efficacy in PBMCs (day 7). (O) Mean tumor volume and (P) survival data (n = 4).
(Q–T) Bilateral-tumor-bearing mice (B78 and M2h) received IgG or 3xTx on the primary tumor. (Q) Treatment regimen. (R) Individual tumor volume and (S) survival data (n = 5–7). (T) Secreted IFN-γ after co-culture of spleen-sorted CD8+ cells and tumor cells (n = 10). Data represent the mean value. Error bars indicate SD. ns, not significant; *p ≤ 0.05; **p ≤ 0.01; ***p ≤ 0.001.
