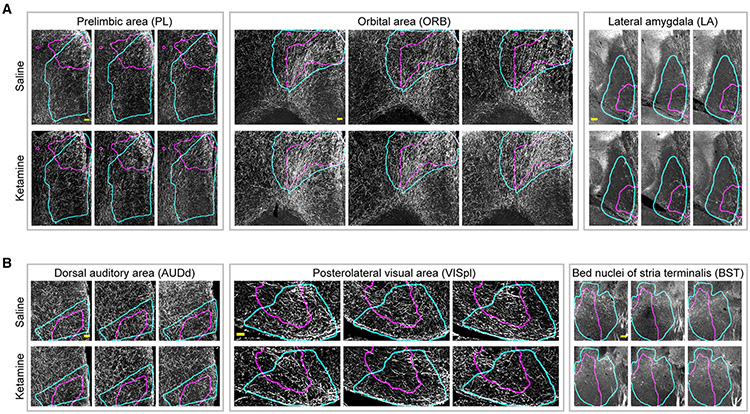
Figure 7. Examples of ketamine-induced alterations in TH+ projections after repeated ketamine exposure.
Representative examples of ABA ROIs showing increases (A) and decreases (B) in TH+ neuronal projections after 10 days of daily ketamine (100 mg/kg) exposure. Cyan and magenta curves outline the spatial location of ABA ROIs and areas with significantly changed projection densities respectively. Images shown are representative single optical planes. See also Videos S7-S12 for complete volumes. All scale bars represent 100 μm.

