
Figure 2. Huddling behavior is an expression of a motivation for physical contact.
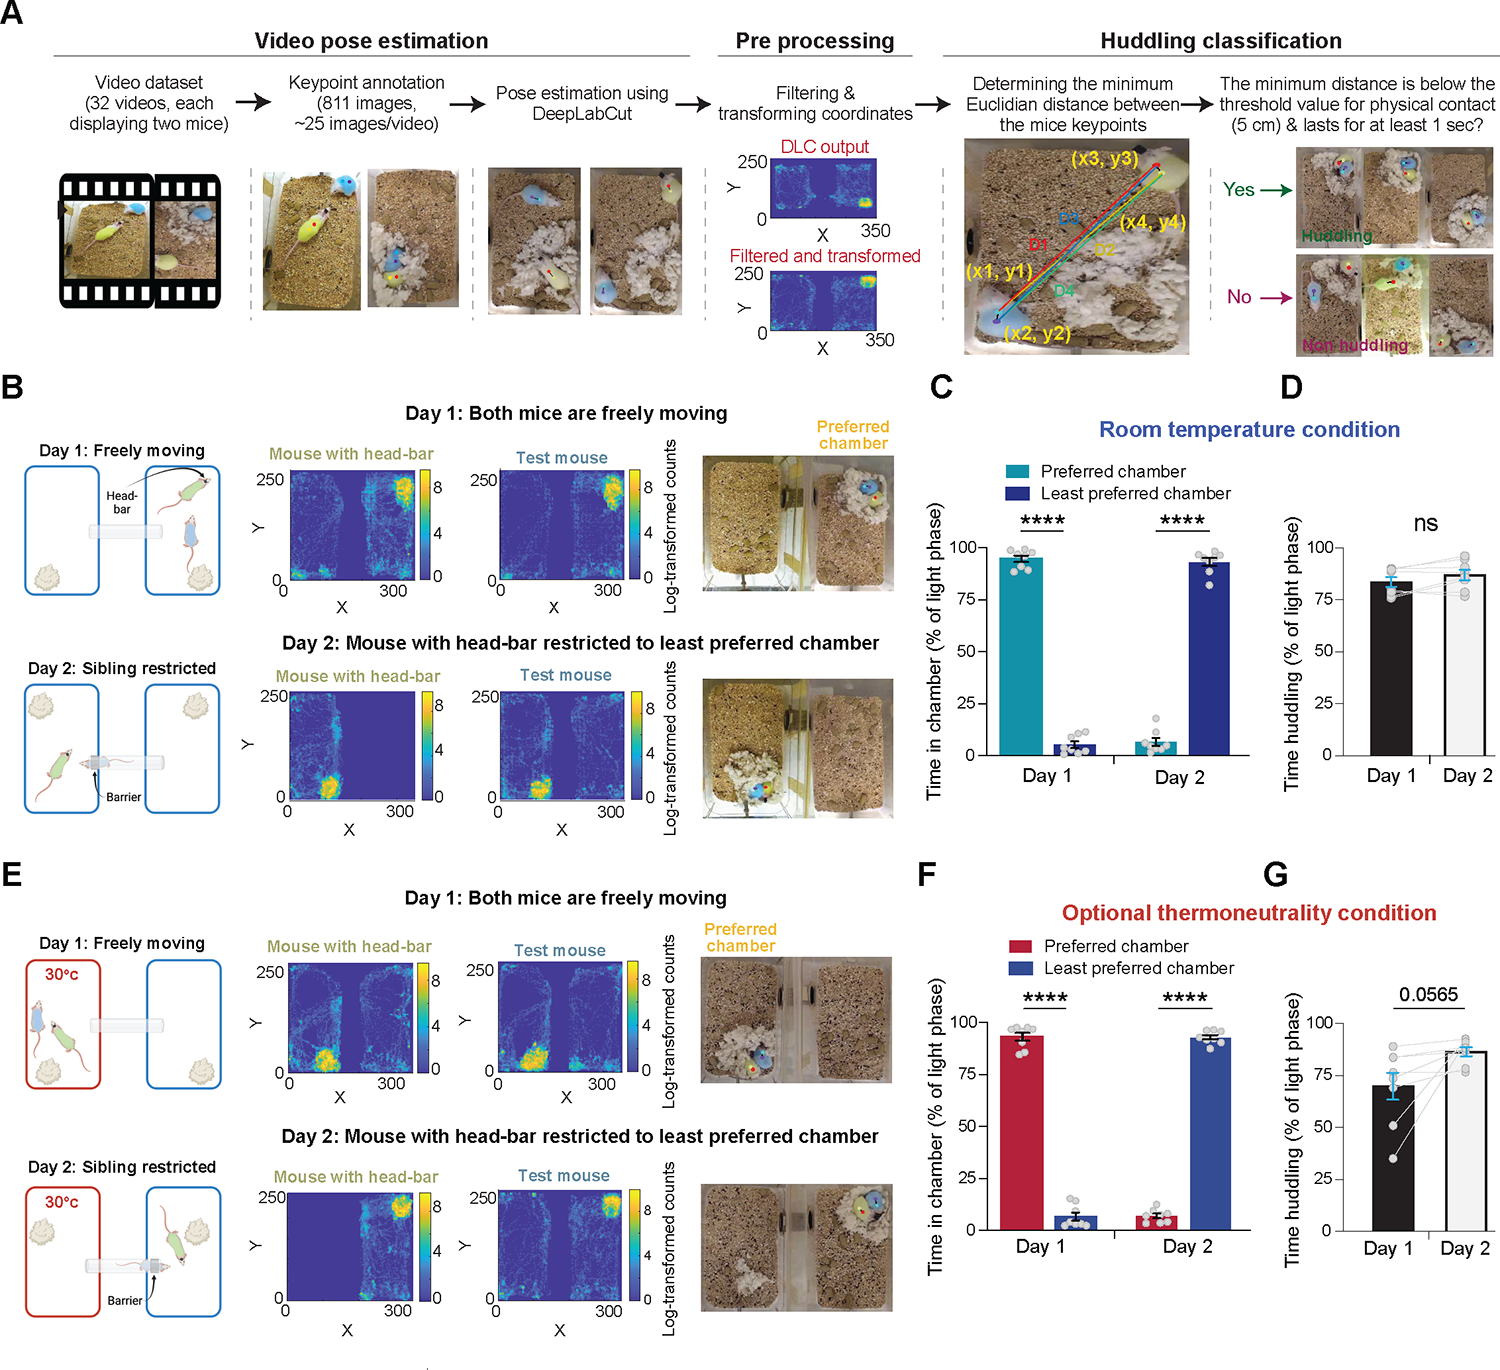
(A) Schematics illustrating the pipeline for pose estimation, coordinate data filtering, and huddling classification. (B) Schematics detailing the two-day ISIA procedure conducted under room temperature conditions, accompanied by representative data. The top row illustrates day 1 under freely moving conditions, while the bottom row details day 2 under sibling restriction conditions. Left: schematic illustrating the ISIA procedure. Middle: representative heatmaps depicting the locations of a head-bar fitted mouse and a test mouse during the 12-hour light cycle in the ISIA apparatus (log transformed histogram counts). Right: snapshots from the DLC tracking output depicting predicted key points, the mice, and their nest. Note that both the heatmaps and snapshots originate from the same recording sessions. (C) Percent time spent in each of the ISIA chambers during the light phase, measured under room temperature conditions, across the two days of the experiment. n = 8 pairs of female and male mice, RM two-way ANOVA (p(day) = 0.03, p(chamber) = 0.57, p(interaction) < 0.0001) followed by Sidak’s multiple comparisons test (****, p < 0.0001). (D) Percent time spent huddling during the light phase, measured under room temperature conditions, across the two days of the experiment. n = 8 pairs of female and male mice, Paired t-test, two-tailed, t = 2.017, df = 7, p = 0.0836. (E) As in (B), but with the ISIA procedure conducted under optional thermoneutrality conditions. This was achieved by maintaining the ambient temperature in one of the chambers at the mice’s thermoneutral zone (30°C). (F) Percent time spent in each of the ISIA chambers during the light phase, measured under optional thermoneutrality conditions, across the two days of the experiment. n = 8 pairs of female and male mice, RM two-way ANOVA (p(day) = 0.16, p(chamber) = 0.9, p(interaction) < 0.0001), followed by Sidak’s multiple comparisons test (****, p < 0.0001). (G) Percent time spent huddling during the light phase, measured under optional thermoneutrality conditions, across the two days of the experiment. n = 8 pairs of female and male mice, Paired t-test, two-tailed, t = 2.281, df = 7, p = 0.0565. See also Figure S1, Figure S2, Video S1, Video S2 and Table 1.