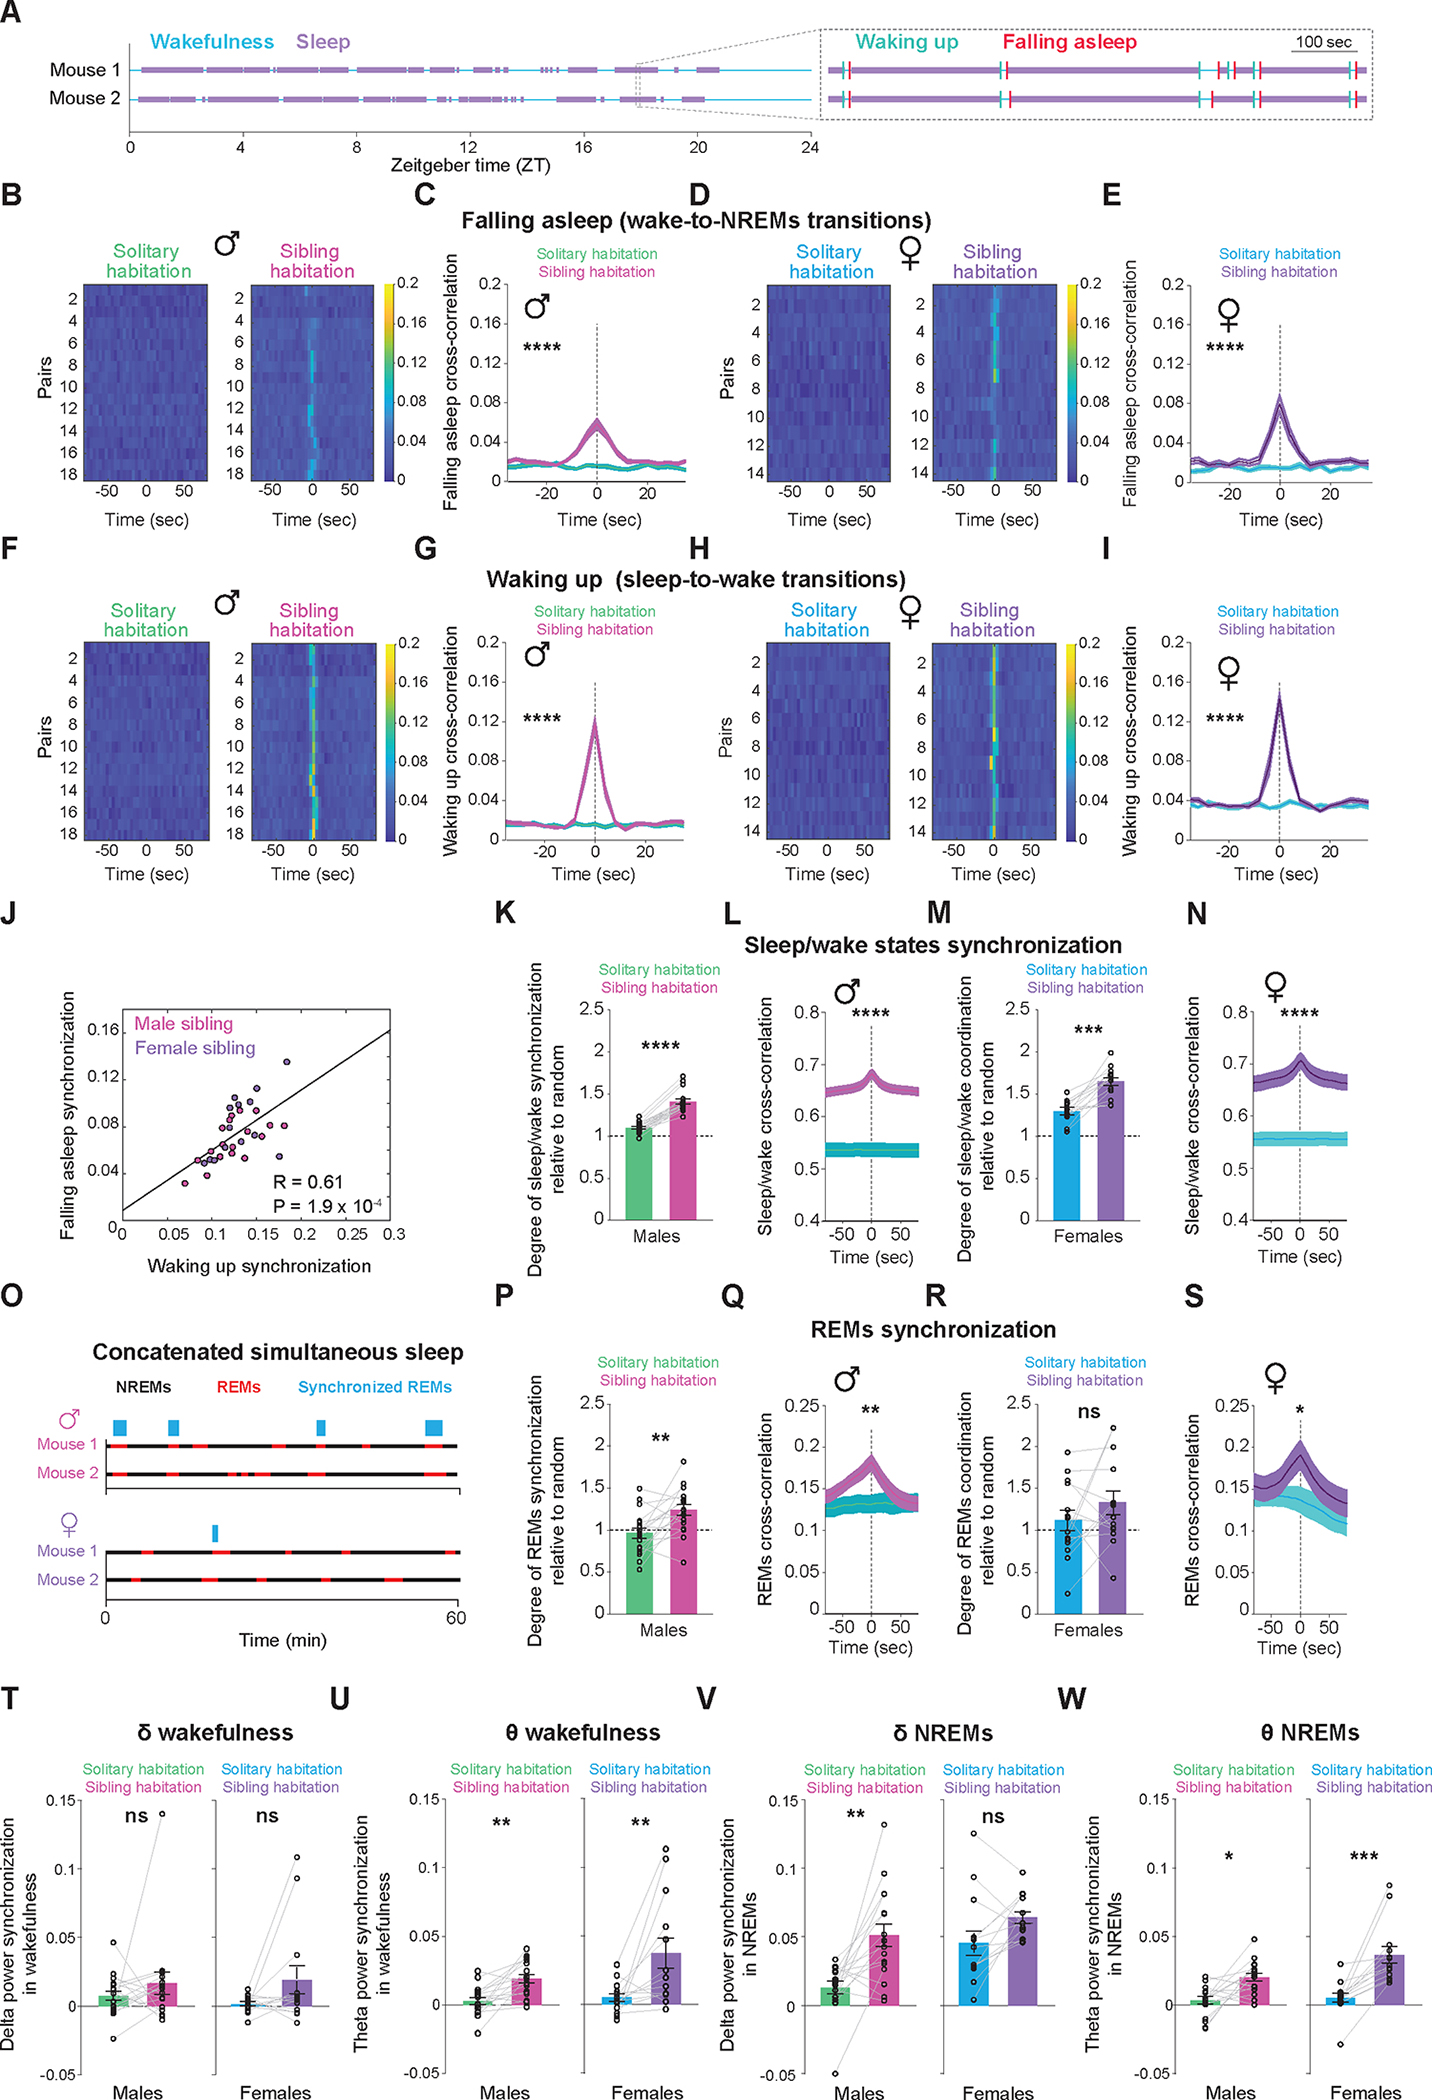
Figure 4: Sibling mice show coordination of multiple neurophysiological features while co-sleeping.

(A) On the left, binary vectors representing wake (depicted in blue) and sleep (depicted in purple) states over a 24-hour period for a pair of sibling mice. On the right, a magnified section of the vectors reveals the exact moments of wake onset (depicted in green) and sleep onset (depicted in red) for the two mice. (B-I) Synchrony of sleep and wake onset times between pairs of mice, either cohabiting in the same home-cage or housed separately within the same experimental room. (B) Heatmap representation of cross-correlation of sleep onset times for each pair of male sibling mice, whether housed together (right) or separately (left). (C) Average cross-correlations of sleep onset times from all male pairs housed separately or together (mean ± S.E.). Shuffle test, p < 0.0001. (D) Same as (B) but for female mice. (E) Same as (C) but for female mice. Shuffle test, p < 0.0001. (F) Heatmap representation of cross-correlation of wake onset times for each pair of male sibling mice, whether housed together (right) or separately (left). (G) Average cross-correlations of wake onset times from all male pairs housed together or separately (mean ± S.E.). Shuffle test, p < 0.0001. (H) Same as (F) but for female mice. (I) Same as (G) but for female mice. Shuffle test, p < 0.0001. (J) Correlation between the degree of synchronization in the timing of falling asleep and the degree of synchronization in the timing of waking up across both male (red) and female (purple) sibling mouse pairs. (K) Synchrony in the overall sleep and wake times between pairs of male sibling mice, either cohabiting in the same home-cage or housed separately within the same experimental room. Wilcoxon rank-sum test, p = 6.6 × 10⁻⁶. (L) Average cross-correlations of overall sleep and wake times from all male pairs housed together or separately (mean ± S.E.). Shuffle test, p < 0.0001. (M) Same as (K), but for females. Wilcoxon rank-sum test, p = 0.00012. (N) Same as (L), but for females. Shuffle test, p < 0.0001. (O) Binary vectors depicting NREMs (shown in black) and REMs (shown in red) states for a pair of sibling mice, with the top representing males and the bottom representing females. Blue rectangles highlight synchronized timepoints of REMs. Notably, bins in which either animal was awake were omitted from both vectors prior to the REMs synchronization quantification. Thus, this analysis specifically quantifies REMs synchronization within the sleep period. (P) Synchrony in the timing of REMs between pairs of male sibling mice, either cohabiting in the same home-cage or housed separately within the same experimental room. Wilcoxon rank-sum test, p = 0.004. (Q) Average cross-correlations of REMs time from all male pairs housed together or separately (mean ± S.E.). Shuffle test, p = 0.00124. (R) Same as (P), but for females. Wilcoxon rank-sum test, p = 0.3258. (S) Same as (Q), but for females. Shuffle test, p =0.2112. (T) Synchrony in the delta (1–4 Hz) band power during wakefulness between pairs of male (left) and female (right) sibling mice, either cohabiting in the same home-cage or housed separately within the same experimental room. Wilcoxon rank-sum test, p(males) = 0.46, p(females) = 0.19. (U) Same as (T) but for theta (5–9 Hz) band power. Wilcoxon rank-sum test, p(males) = 0.001, p(females) = 0.006. (V) Same as (T) but for NREMs. Wilcoxon rank-sum test, p(males) = 0.0017, p(females) = 0.0942. (W) Same as (U) but for NREMs. Wilcoxon rank-sum test, p(males) = 0.0109, p(females) = 0.0002.
