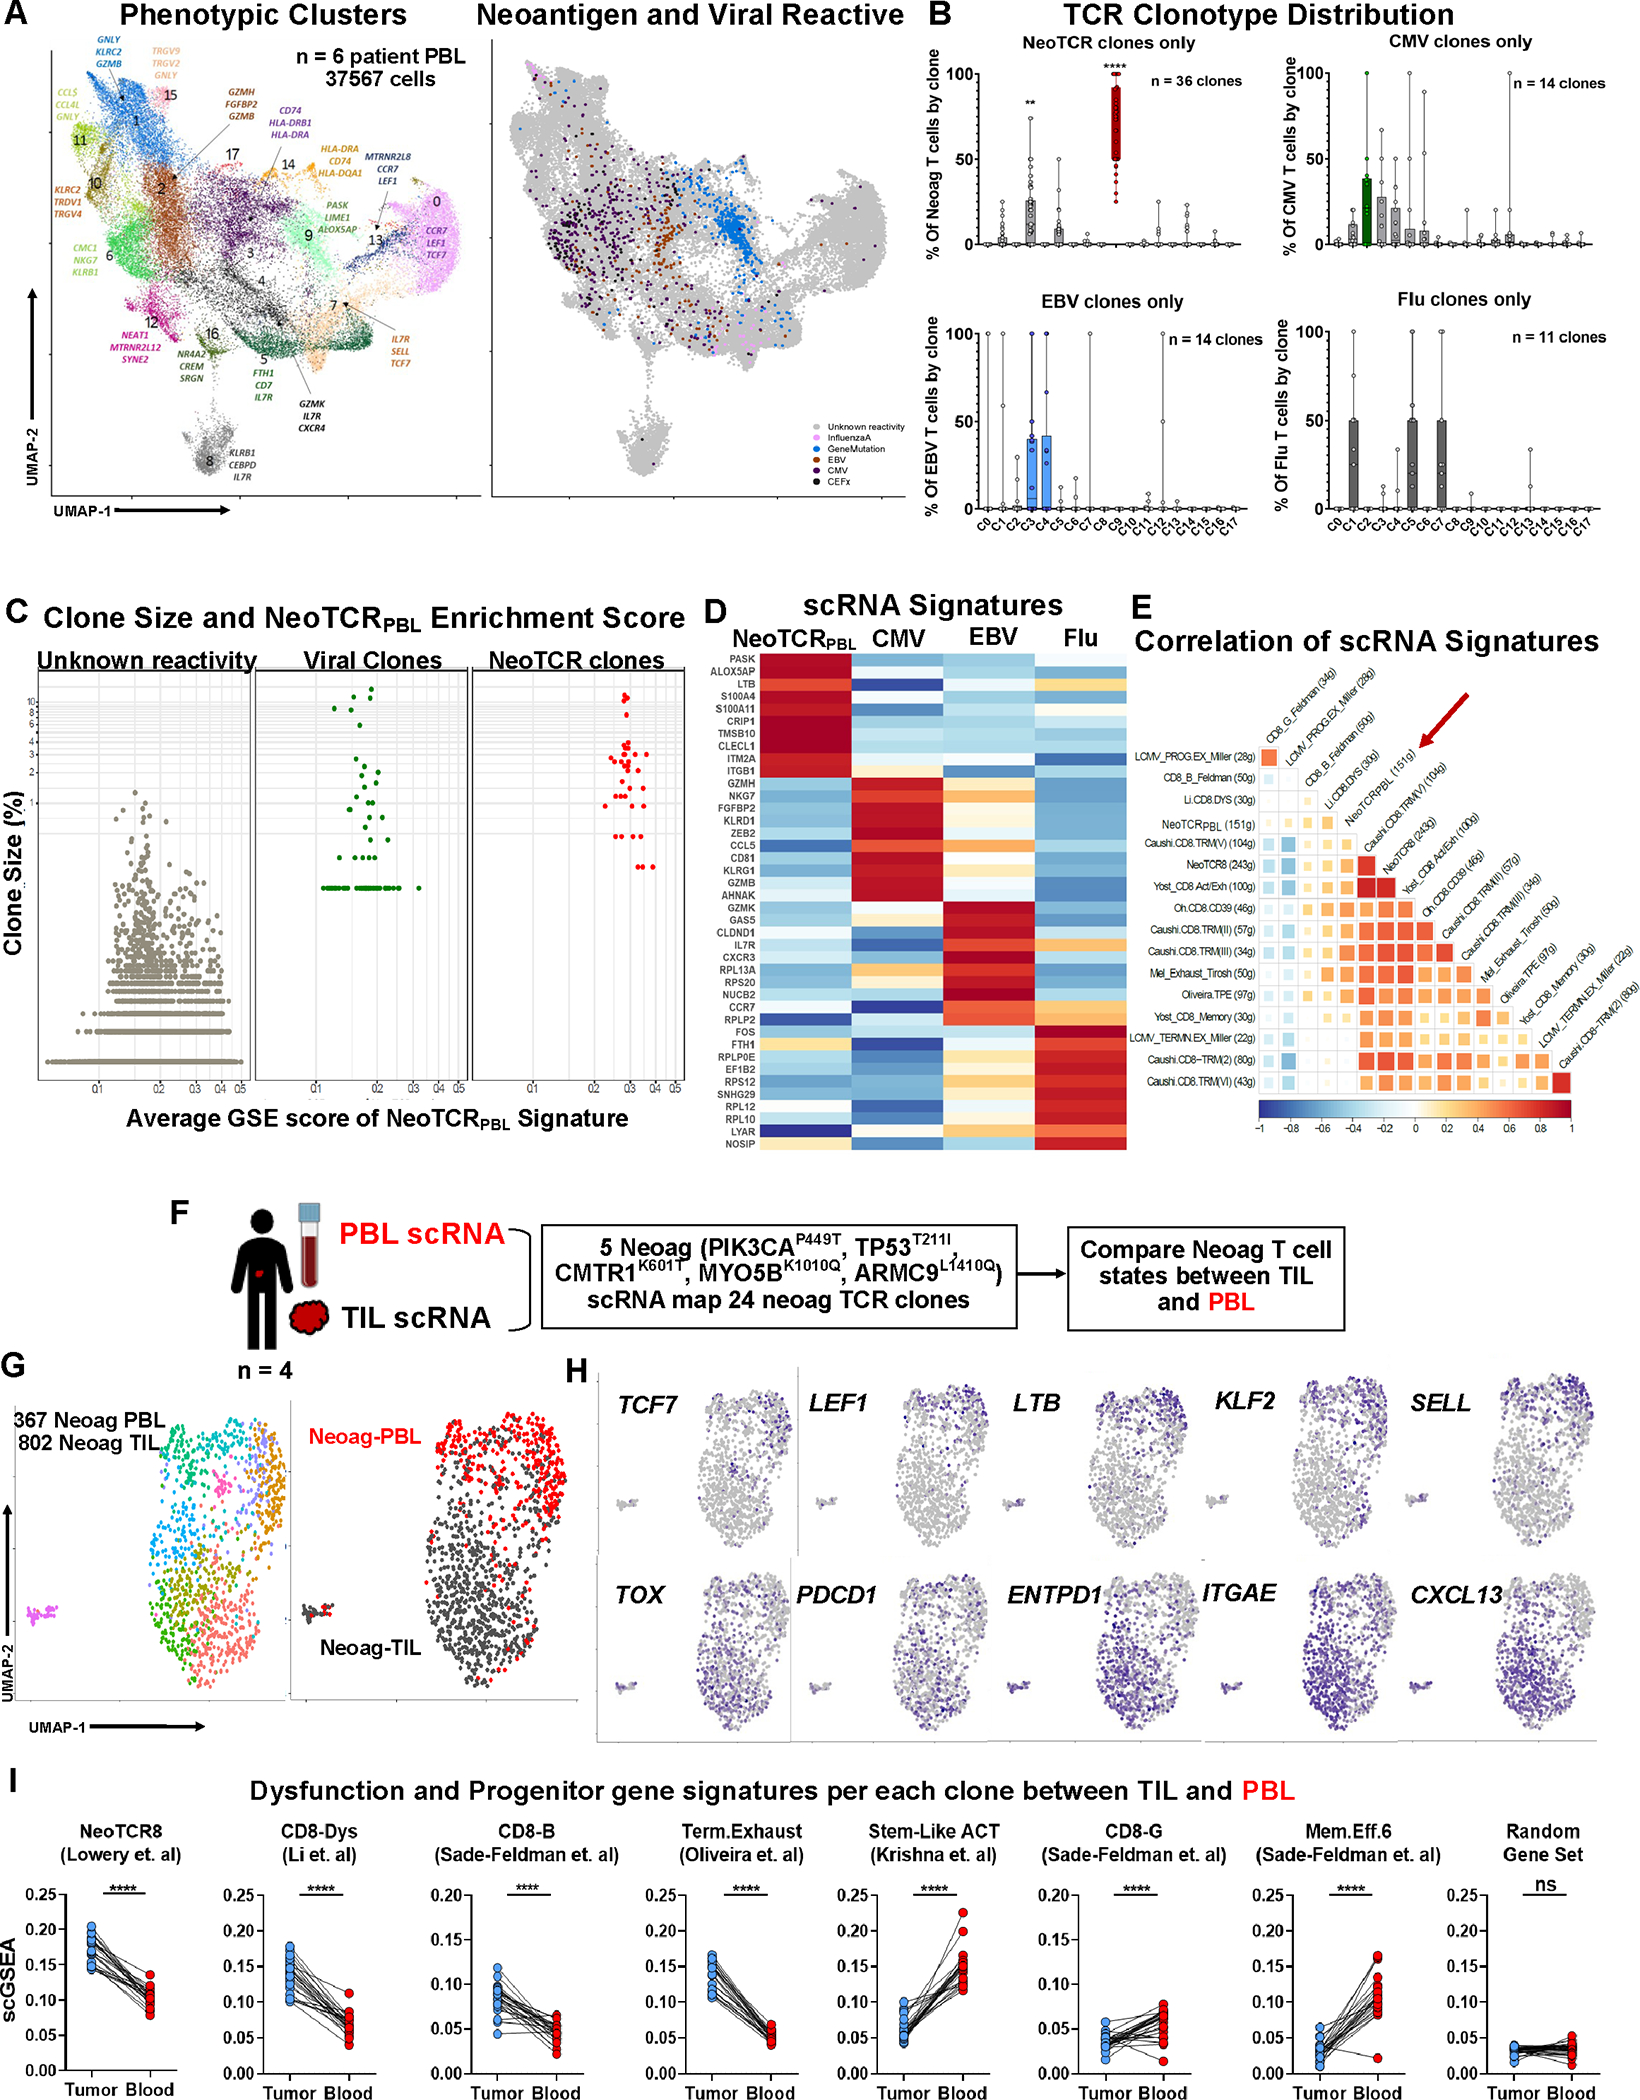
Figure 2: Transcriptional program of circulating neoantigen-reactive CD8+ T cells.

(A) Transcriptional clustering and UMAP projection of circulating CD8+ cells from six metastatic cancer patients’ blood samples (Left) and Projection of neoantigen- and viral-reactive clones on the UMAP space (right). (B) Frequency of neoantigen- and viral-reactive clones within UMAP clusters. **P < 0.01, ****P < 0.001 by Two-way ANOVA adjusted by Bonferroni multiple corrections (C) Comparison of clonal frequency and average NeoTCRPBL signature score by scGSEA within neoantigen-, viral-specific clones, and rest of clones with unknown-reactivities. Welch Two Sample t-test of clone size between viral and NeoTCRPBL clones P = 0.227. (D) Heatmap of top 10 differentially expressed genes between Neoantigen-, CMV, EBV-, and InfluenzaA-reactive T cells from the six patient PBL. (E) Pearson correlation between public TIL gene-signatures and NeoTCRPBL. (F) Schematic representing the combined TIL + PBL neoantigen T cell phenotypic states analysis within each patient. (G) UMAP displaying the combined analysis of neoantigen-specific T cells (24 total neoantigen T cell clones) from each of the 4 patients (left panel), and segregation of transcriptomic states based on their TIL compartment (Neoag-TIL) or peripheral blood compartment (Neoag-PBL) (right panel). (H) Gene expression of candidate memory progenitor genes (top panel), and tissue-residency, dysfunctional T cell genes (bottom panel) across the combined TIL-PBL UMAP. (I) Average gene signature scores (scGSEA) scores of immunotherapy response and non-response associated gene signatures that indicate T cell dysfunction, stem-like progenitor states within each individual neoantigen-reactive clone (n = 24) compared between its TIL compartment and PBL compartment from all 4 patients. Random gene set of 50 genes are displayed as control gene signature. ****P < 0.0001 by Paired T-test per each neoantigen T cell clonotype. Also see Fig S.4–5 and Table S1–2.
