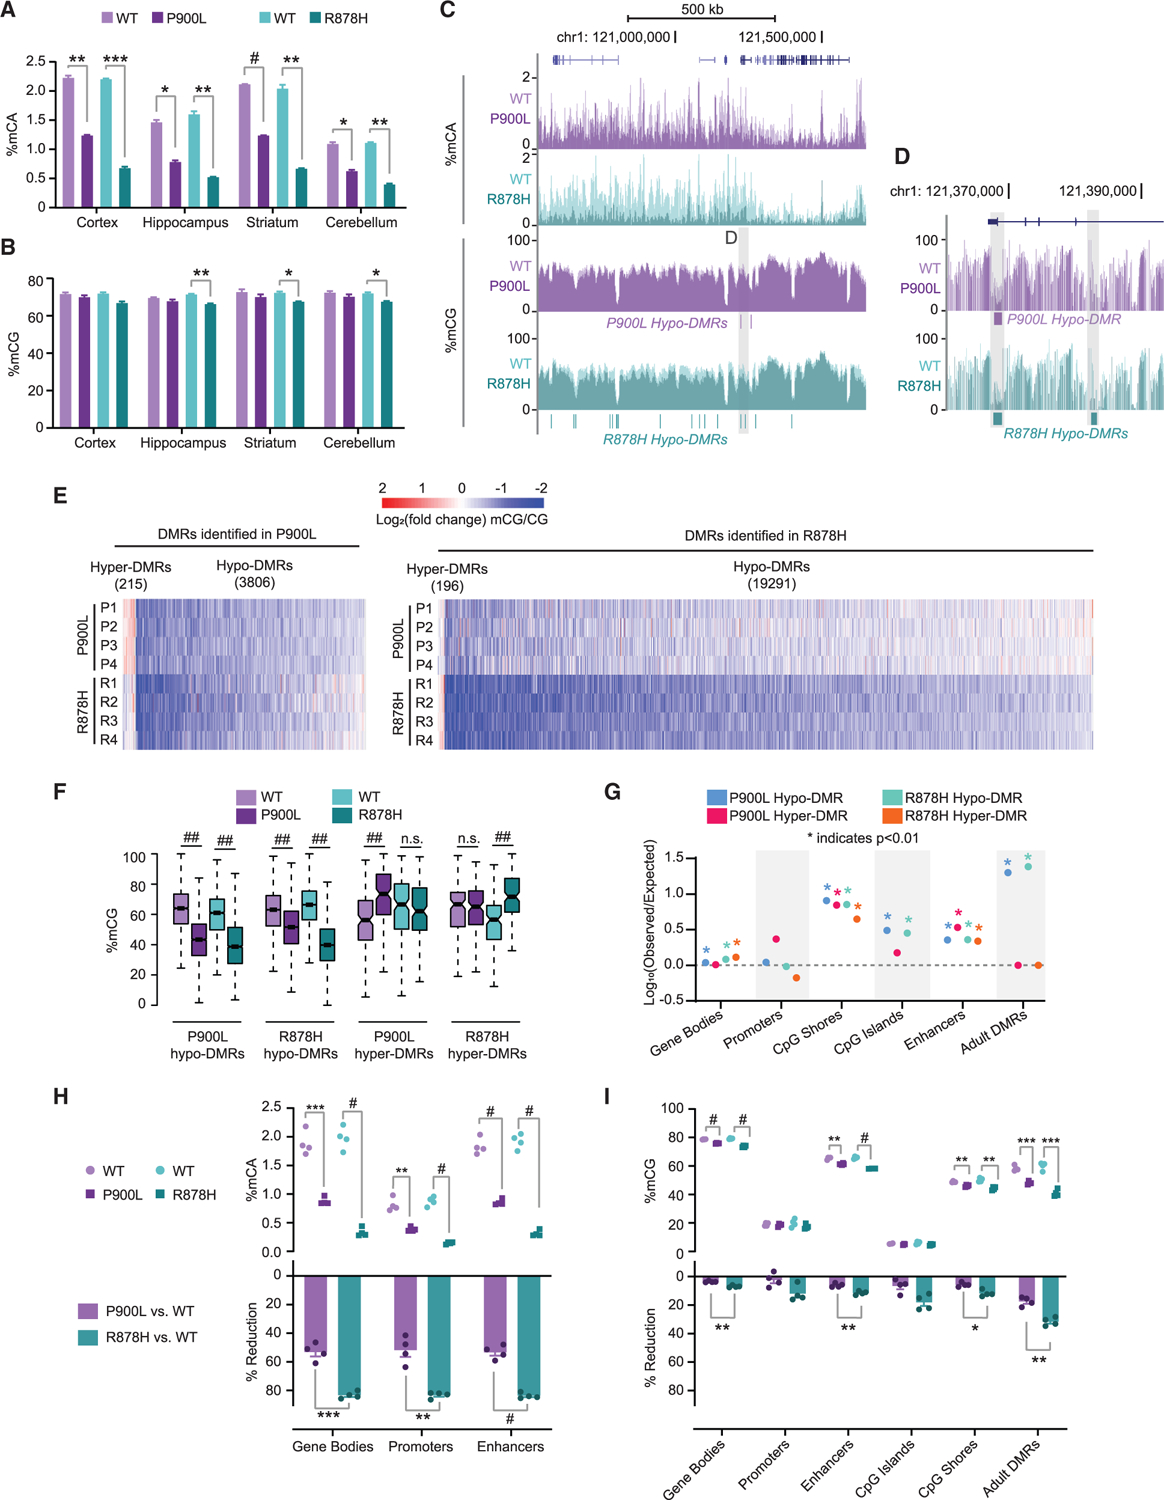
Figure 4. DNMT3A mutants have significant changes to DNA methylation, with more extreme changes in the R878H mutant compared to the P900L.

(A and B) Average genome-wide (A) percentage of mCA and (B) percentage of mCG from brain regions.
(C) Representative genome browser view showing percentages of mCA and mCG.
(D) Zoom browser view showing changes in mCG at hypo-DMRs.
(E) Heatmap of CG-DMRs identified in P900L and R878H mutants vs. their WT littermates. Log2(fold change) mCG/CG indicated between each littermate pair for each DMR.
(F) Average mCG in each genotype at DMRs called in both mutant strains.
(G) Overlap analysis of DMRs with genomic regions of interest. No point indicated for R878H hyper-DMRs CpG islands due to 0 resampled DMRs overlapping.
(H) Average mCA level at regions of interest (top) and percentage of reduction of mCA between WT and mutants (bottom).
(I) Average mCG level at regions of interest (top) and percentage of reduction of mCG between WT and mutants (bottom).
Bar graphs indicate mean ± SEM. Notched box and whisker plots indicate median, interquartile, and confidence interval of median. All groups n = 4, 2 male, 2 female. Detailed statistics and sample sizes are in Table S1. *p < 0.05; **p < 0.01; ***p < 0.001; #p < 0.0001; ##p < 2e–10.
