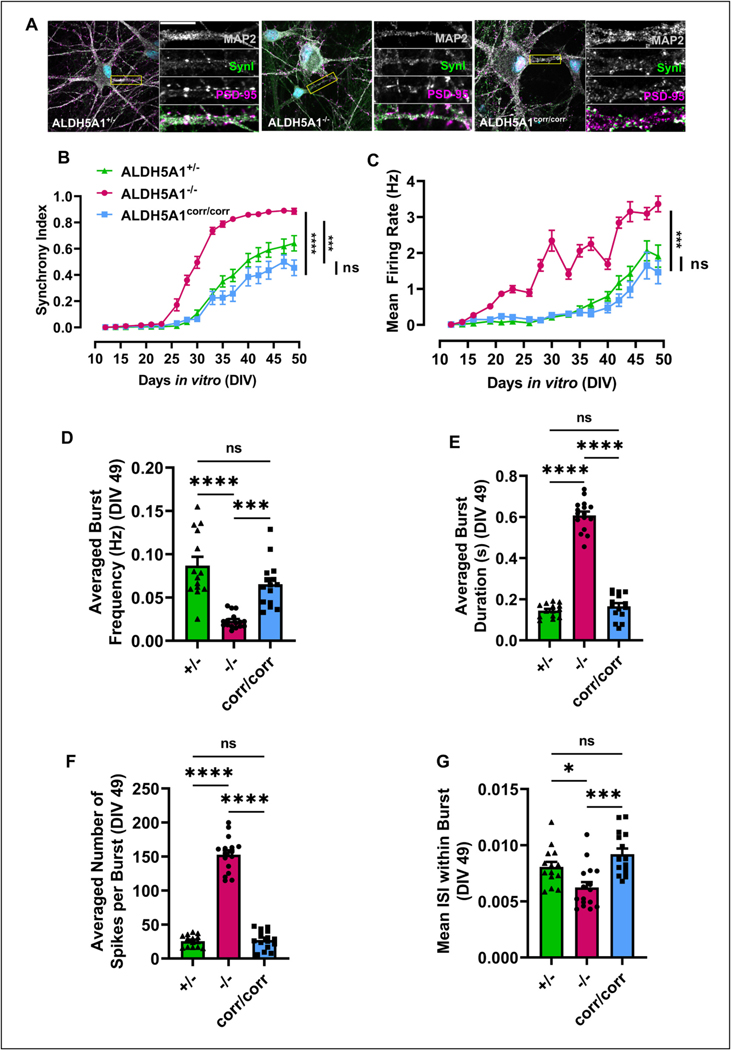
Fig. 3. Characterization of the developing neuronal network in cultures of SSADH-deficient iNs.
(A) Representative images of hiPSC-derived iNs from parental control (ALDH5A1+/−), patient (ALDH5A1−/−) and CRISPR corrected (ALDH5A1corr/corr) at DIV 50 labelled with MAP2 (gray), SYN I (green) and PSD95 (magenta) in co-culture with hiPSC-derived astrocytes. Scale bar 10 μm. Multi electrode array analysis shows (B) synchrony index and (C) mean firing rate of hiPSC-derived iNs from all genotypes in co-culture with hiPSC-derived astrocytes plotted over time (DIV10 up to DIV50). n = 3 independent differentiations; 16 independent wells per differentiation; two-way ANOVA with Tukey’s multiple comparisons test; F (32, 765) = 8.031; ****p < 0.0001; ***p < 0.001; ns = non-significant). We compiled bursting activity at DIV49 (D) average burst frequency F (2, 42) = 6.531 (E) averaged burst duration F (2, 42) = 2.743 (F) averaged number of spikes per burst F (2, 42) = 5.180 (G) mean inter spike interval (ISI) within burst F (2, 42) = 0.2319 (mean ± s.e.m.; n = 3 independent differentiations; 16 independent wells per differentiation; one-way ANOVA with Tukey’s multiple comparisons test; ****p < 0.0001; **p < 0.01; *p < 0.05; ns = non-significant). (For interpretation of the references to colour in this figure legend, the reader is referred to the web version of this article.)

