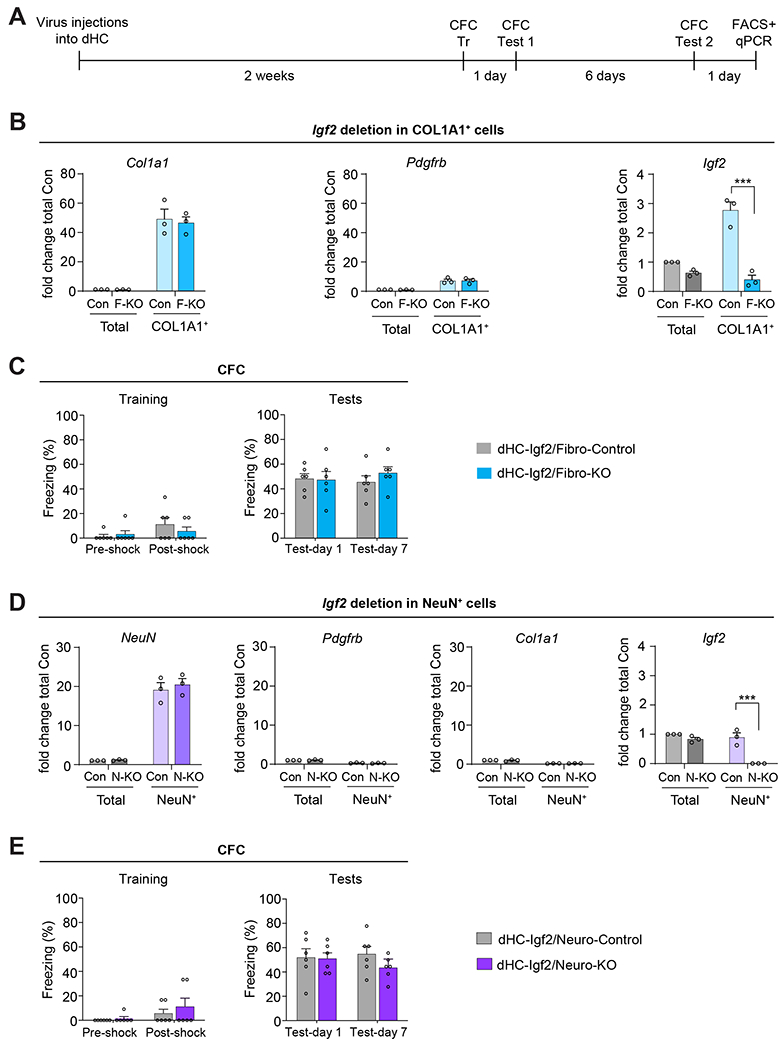
Figure 6: Igf2 knockout in dHC fibroblasts or neurons does not affect contextual fear memory.

(A) Experimental schedule. Fibroblast or neuron-specific Igf2 deletion was induced in Igf2-floxed mice by injecting into their dHC a virus expressing Cre-recombinase under the Col1a1 promoter to target fibroblasts [(dHC-Igf2/Fibro-KO or F-KO) or GFP (dHC-Igf2/Fibro-Control or Con) sequence)], or under hSyn promoter to target neurons [(dHC-Igf2/Neuro-KO or N-KO) or GFP (dHC-Igf2/Neuro-Control or Con)]. (B) qPCR analyses of Col1a1, Pdgfrb, and Igf2 mRNA from dHC (total) and FACS-purified COL1A1+ cells (fibroblasts) from dHC-Igf2/Fibro-KO or dHC-Igf2/Fibro-Control mice. Data are shown as fold change relative to the mRNA levels of the dHC (total) extract obtained from dHC-Igf2/Fibro-Control mice (Con, Total). n = 2-3 mice were pooled in each experiment, 3 independent experiments. Dots on graphs represent the value for each experiment. Two-way ANOVA followed by Sidak’s post-hoc test. *** p < 0.001. (C) CFC training (left panel) and memory tested at 1 and 7 days after training (right panel). CFC memory is expressed as mean percent freezing ± s.e.m; n = 6 mice/group, 2 independent experiments. Dots on graphs represent the value for each mouse. Two-way RM ANOVA followed by Bonferroni’s post-hoc test. (D) qPCR analyses of NeuN, Pdgfrb, Col1a1, and Igf2 mRNA in the RNA extracts from dHC (total) and FACS-purified NeuN+ cells (neurons) of dHC-Igf2/Neuro-KO or dHC-Igf2/Neuro-Control mice. Data are shown as fold change relative to the mRNA levels in the dHC (total) extract obtained from dHC-Igf2/Neuro-Control mice (Con, Total); n = 2-3 mice pooled in each experiment, 3 independent experiments. Dots on graphs represent the value for each experiment. Two-way ANOVA followed by Sidak’s post-hoc test. *** p < 0.001. (E) CFC training (left panel) and memory tested at 1 and 7 days after training (right panel). CFC memory is expressed as mean percent freezing ± s.e.m; n = 6 mice/group, 2 independent experiments. Dots on graphs represent the value for each mouse. Two-way RM ANOVA followed by Bonferroni’s post-hoc test. Numeric values and detailed statistical analyses are reported in Table S1. Primers for qPCR in Table S3. Markers for fibroblasts Col1a1 and Pdgfrb; neurons: NeuN; pericytes: Pdgfrb.
