
Figure 1:
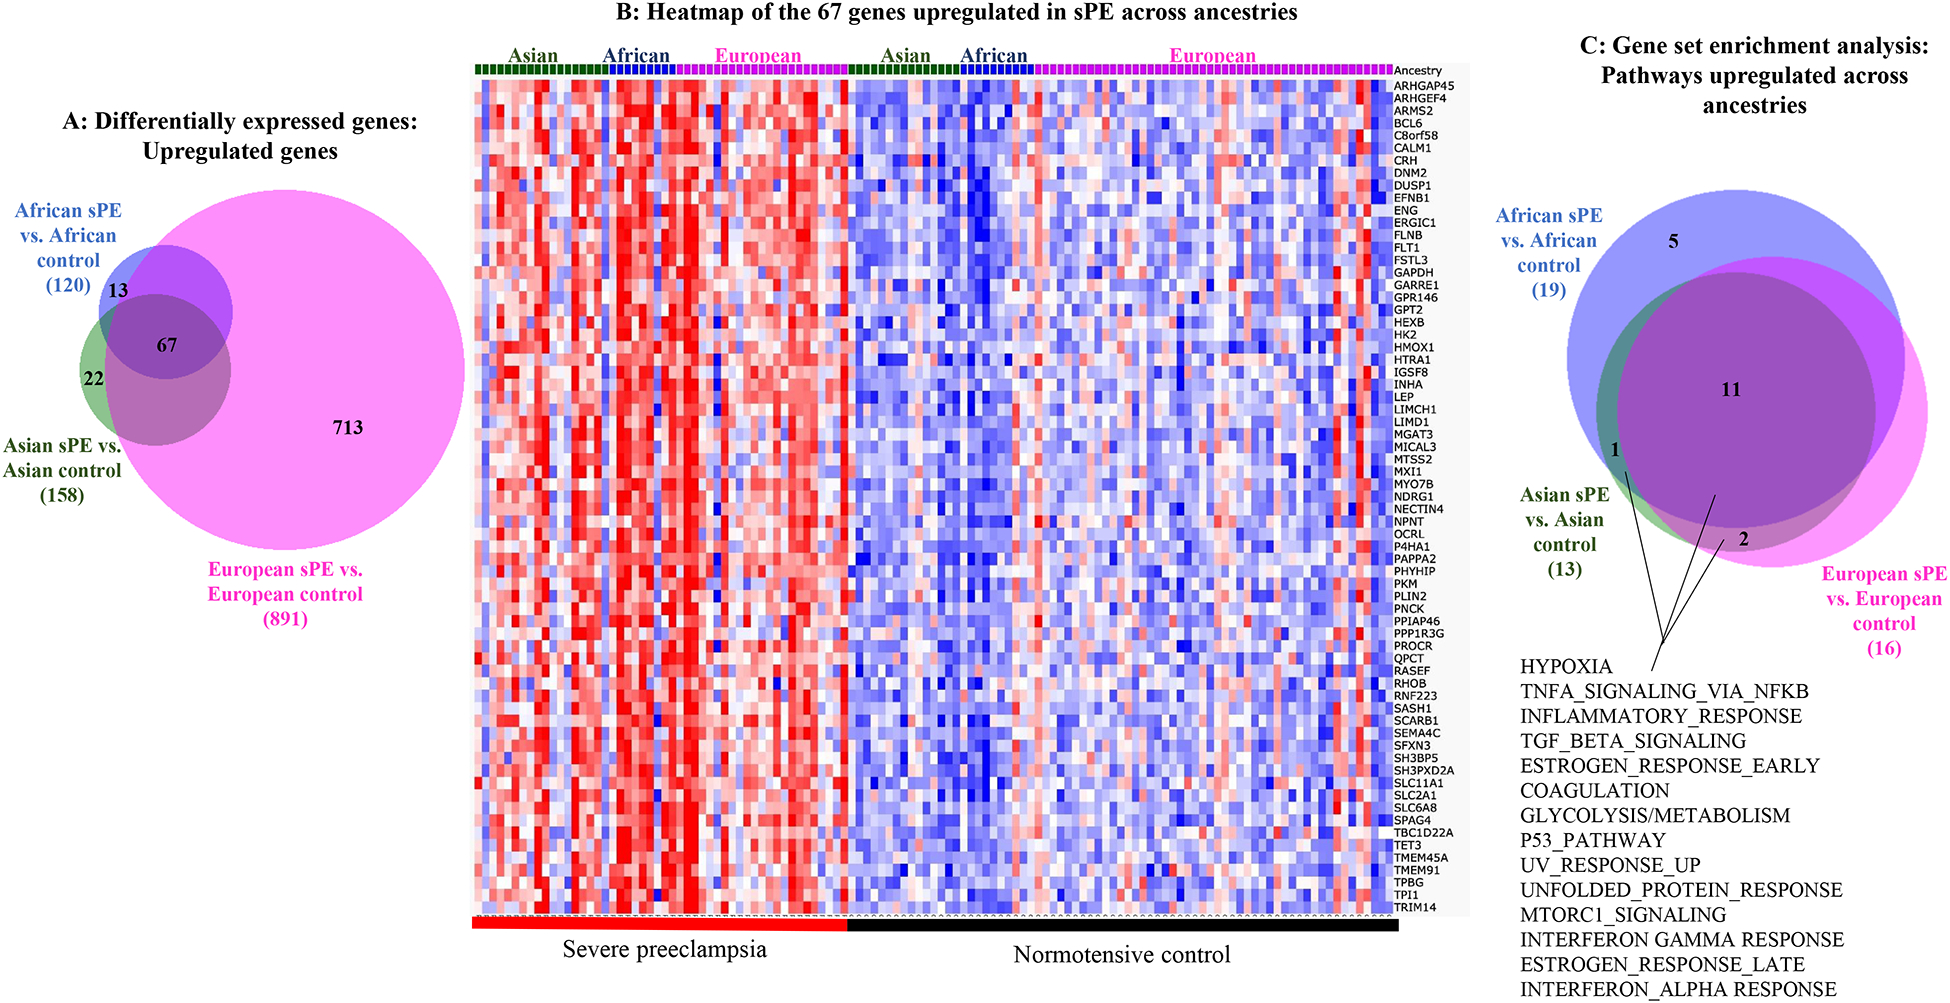
Genes and pathways upregulated in common in placentas from severe PE versus normotensive patients of African, Asian and European ancestries. A. Differential gene expression analysis of sPE vs. normotensive controls within each ancestry showing the numbers of protein-coding genes that are significantly upregulated (with DESeq2 calculated adjusted p values of <.05) in sPE versus normotensive placentas of each ancestry. B. Heat map of the 67 protein-coding genes upregulated in patients of all three ancestries with sPE. C. Results of gene set enrichment analysis showing signaling pathways upregulated in sPE versus normotensive placentas.