
Fig. 2.
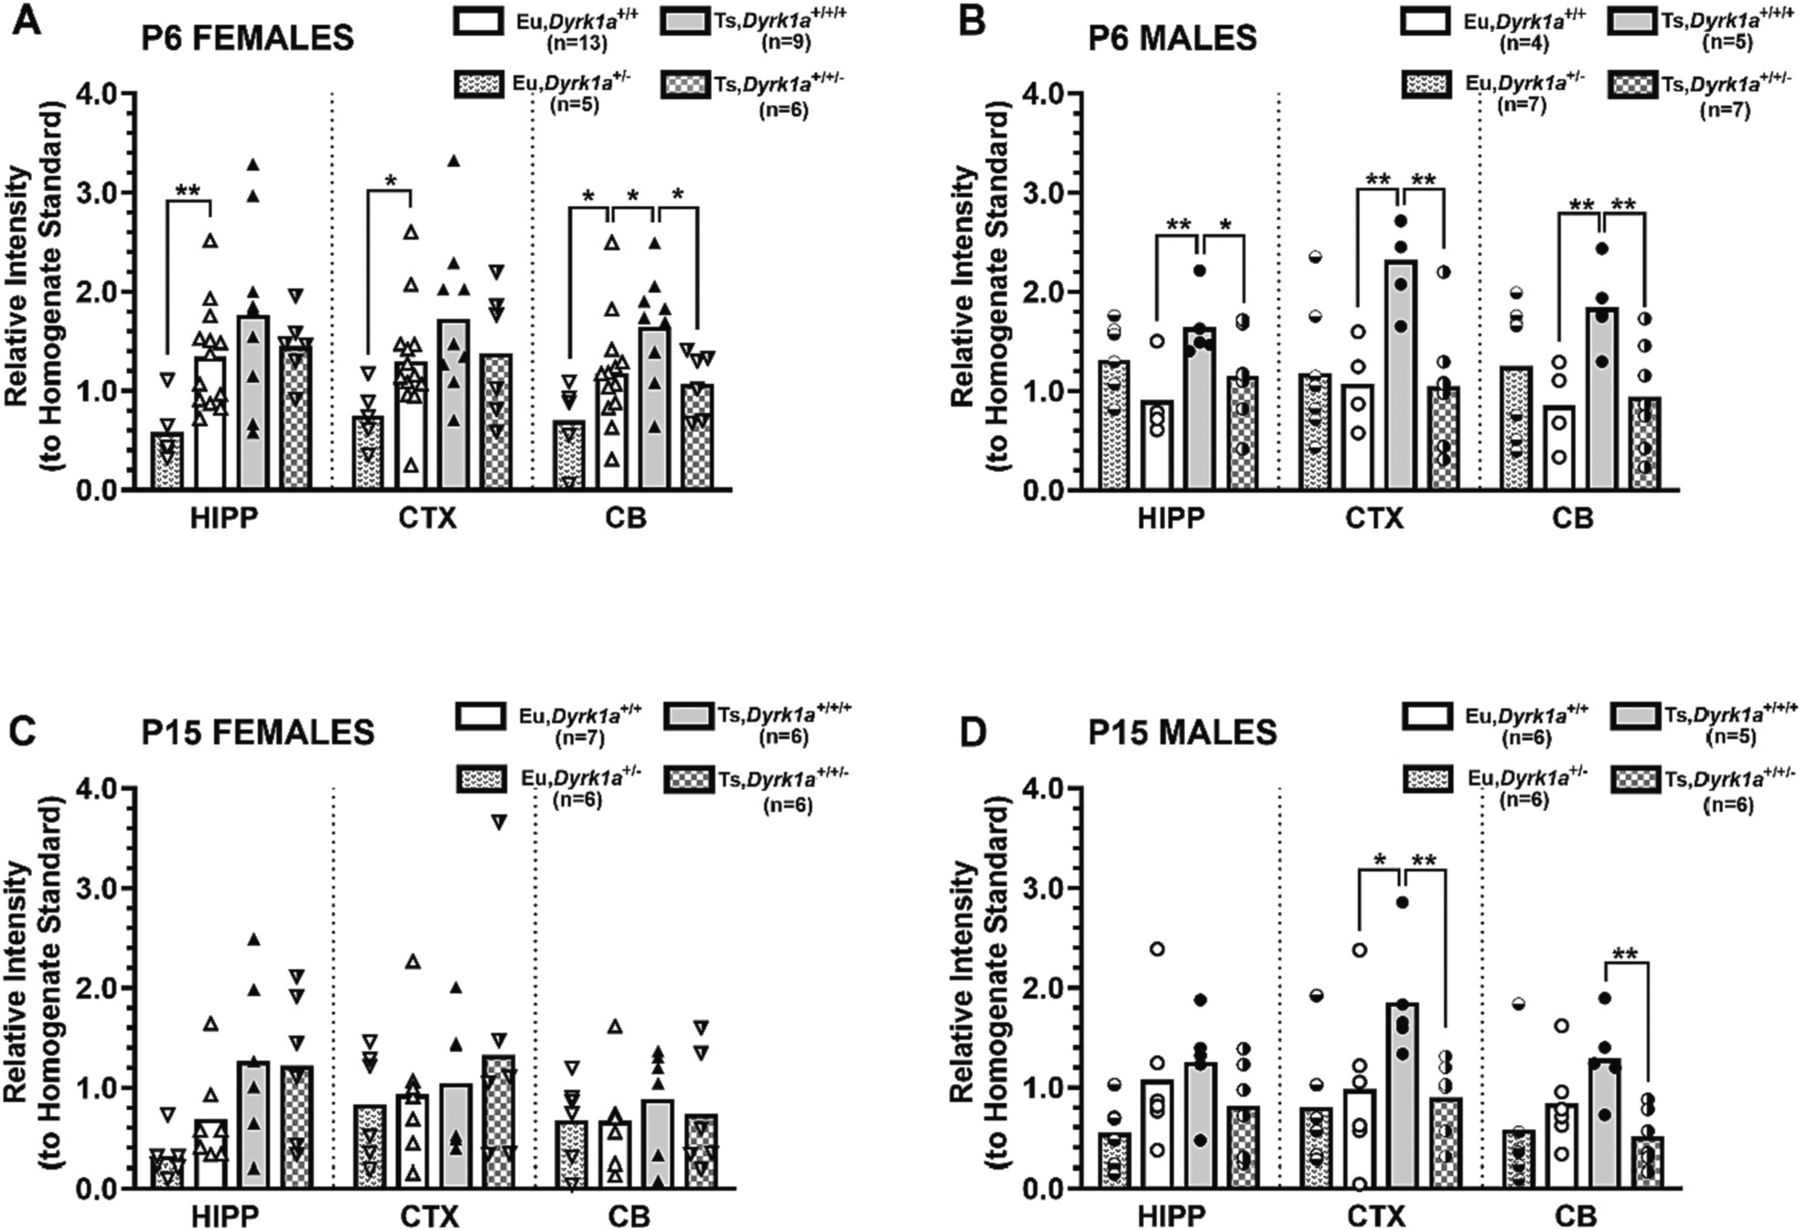
Dyrk1a copy number reduction normalizes DYRK1A expression in developing Ts65Dn mice. DYRK1A expression in P6 and P15 offspring from Ts65Dn × Dyrk1a+/− matings, with data shown as scatterplot with group mean. Three a priori directional hypotheses were tested for each brain region at each age: a) Ts, Dyrk1a+/+/+ > Eu,Dyrk1a+/+; b) Ts,Dyrk1a+/+/+ > Ts,Dyrk1a+/+/−; and c) Eu,Dyrk1a+/+ > Eu,Dyrk1a+/−, alpha = 0.05 for each region.