
Fig. 4.
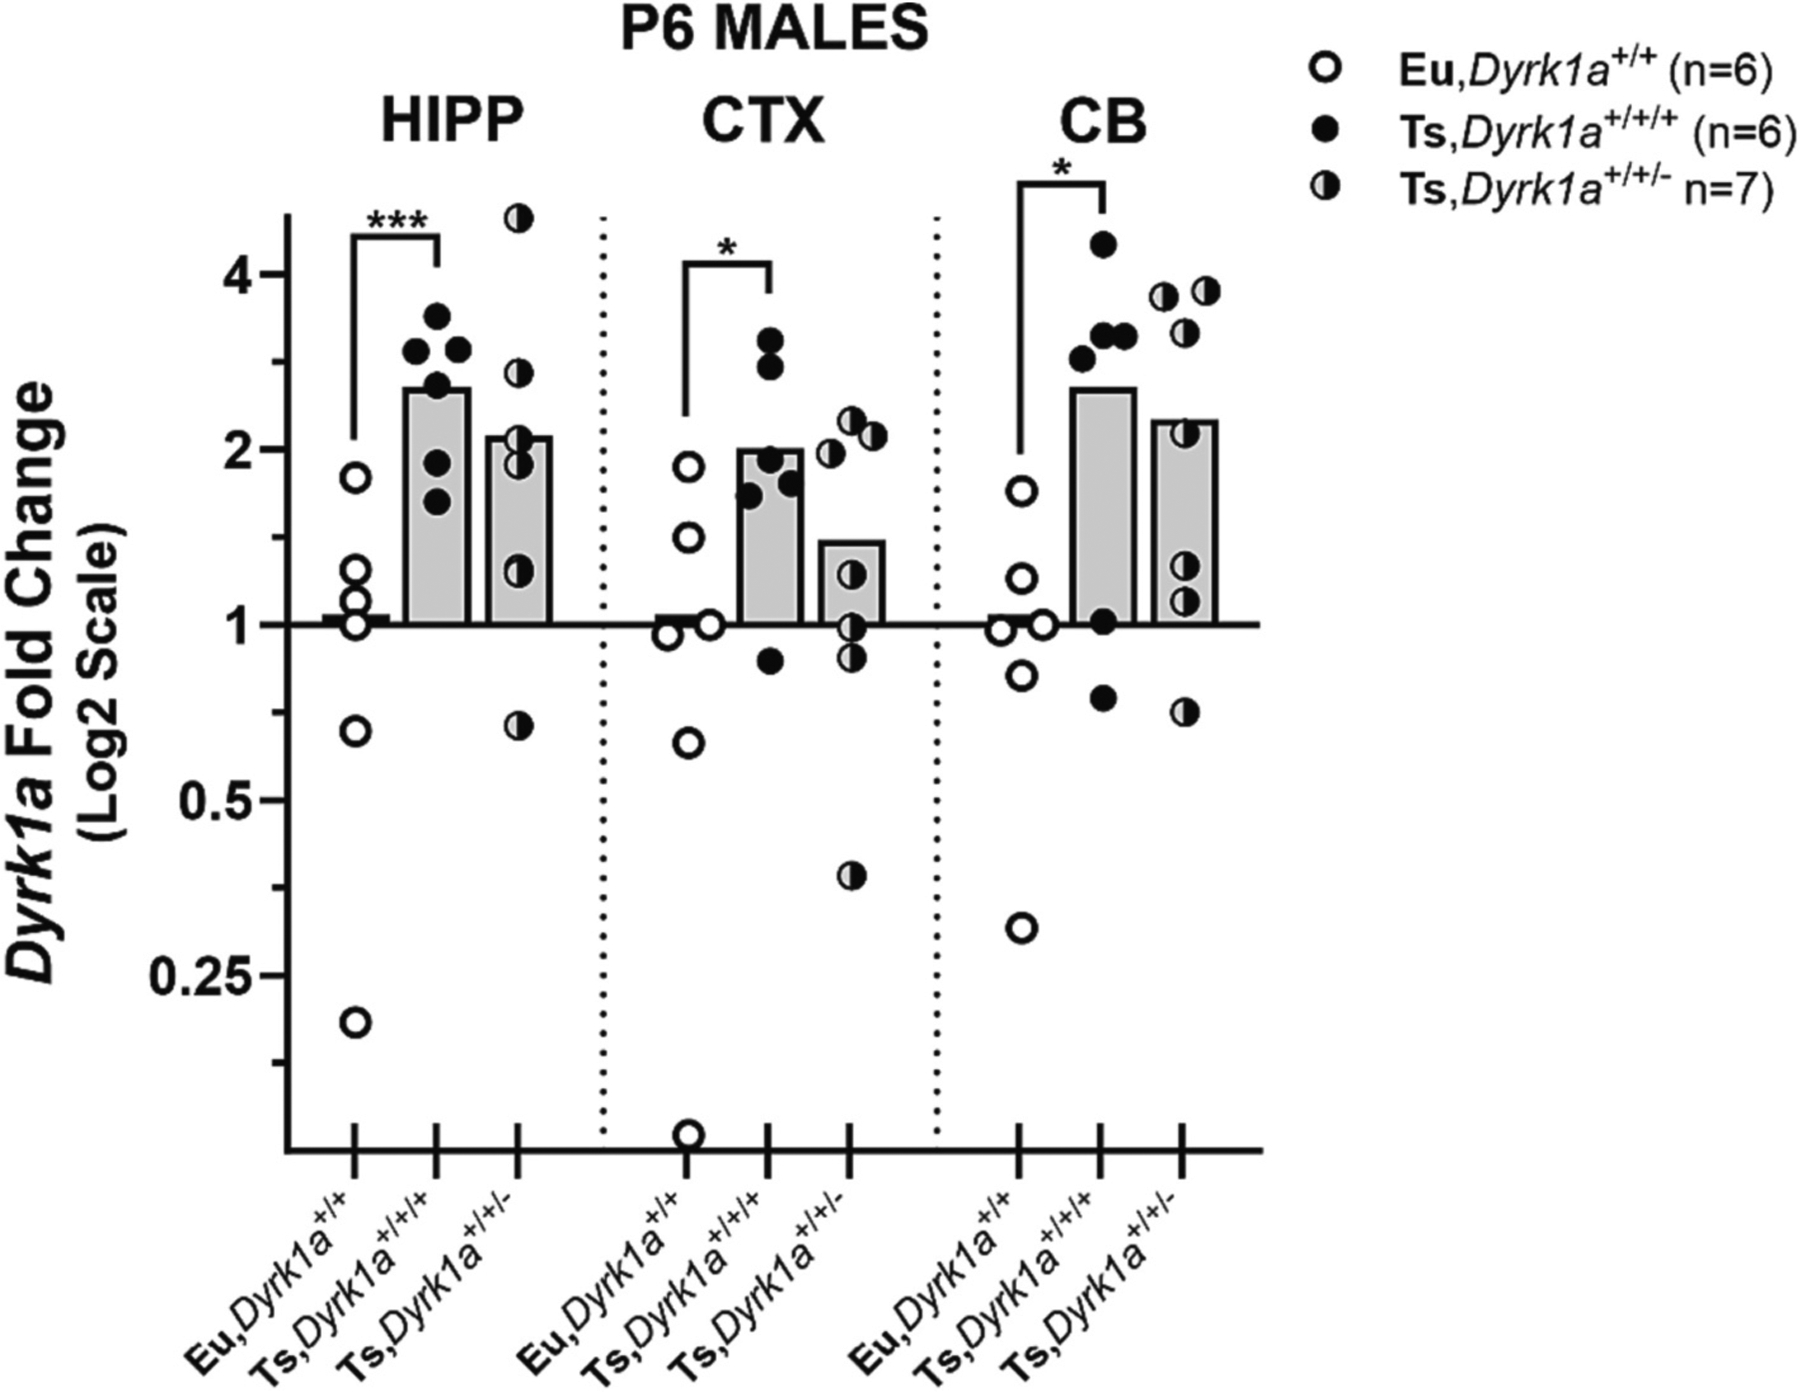
Effects of Dyrk1a copy number reduction on Dyrk1a mRNA expression in P6 male Ts65Dn mice. Quantitative polymerase chain reaction (qPCR) analysis was performed in mice of each genotype: euploid (Eu,Dyrk1a+/+), Trisomic (Ts,Dyrk1a+/+/+), and trisomic with 2 copies of Dyrk1a Ts,Dyrk1a+/+/−). Relative fold change was calculated using the 2−ΔCT comparative method relative to within-plate euploid means. Two directional hypotheses regarding the expression of Dyrk1a mRNA were tested separately for each brain region: a) Ts,Dyrk1a+/+/+ > Eu,Dyrk1a+/+ and b) Ts,Dyrk1a+/+/+ > Ts,Dyrk1a+/+/−, using one-tailed independent groups t-tests (alpha = 0.05). Data are shown as scatterplots with group means and plotted using a log 2 scale (euploid means = 1).