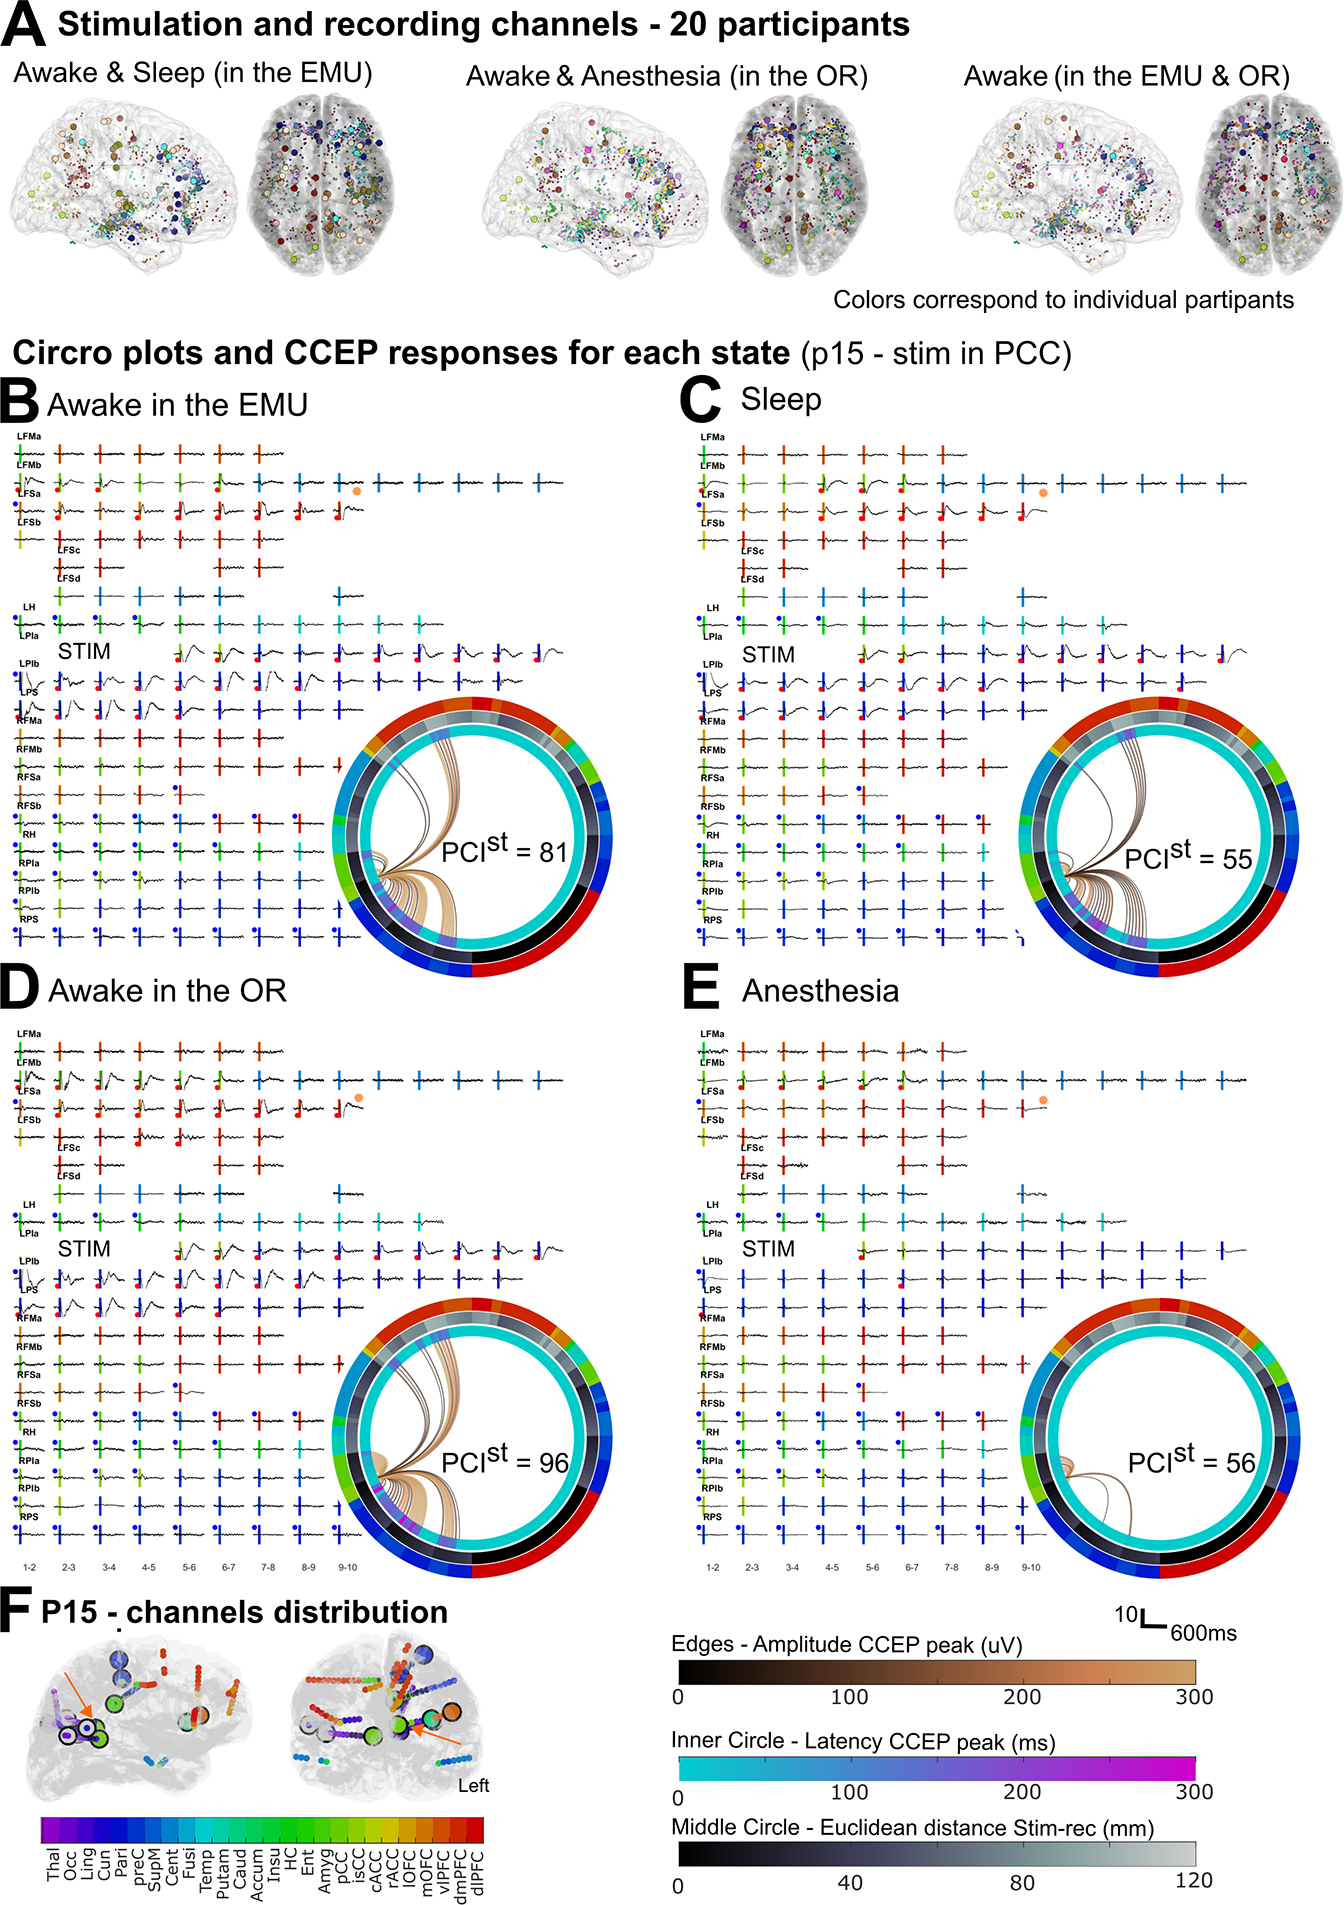
Figure 1. CCEP response to stimulation in different brain states.

(A) Distribution of stimulation (circles) and recording (dots) channels across the N = 20 participants grouped by awake and sleep in the EMU (N = 13; s = 99 stimulation channels; r = 1547 recording channels), and awake and propofol-induced general anesthesia before electrode explantation in the OR (N = 14, s = 3635, r = 1709), and awake in the EMU and the OR (N = 13, s = 34, r = 1479). B-E) CCEP responses in a representative participant (p15) while awake (B) and during natural sleep (C); while awake (D) and under anesthesia (E). Vertical line: stimulation time, with color denoting anatomical location; orange dot: example in Fig. 2.b. Inset (B-E): Circro plots with edges as connections from stimulation to recording channels. Edge color: amplitude of the most prominent peak (hot colormap); inner circle: latency of the first peak (winter colormap); middle circle: Euclidean distance between recording and stimulation channel (bone colormap); outer ring: anatomical location. Left (right) half corresponds to channels in the left (right) hemisphere. F) Channels distribution for this participant. Orange arrows: stimulation channel in B-E. See also Fig. S1 and Table S1.
