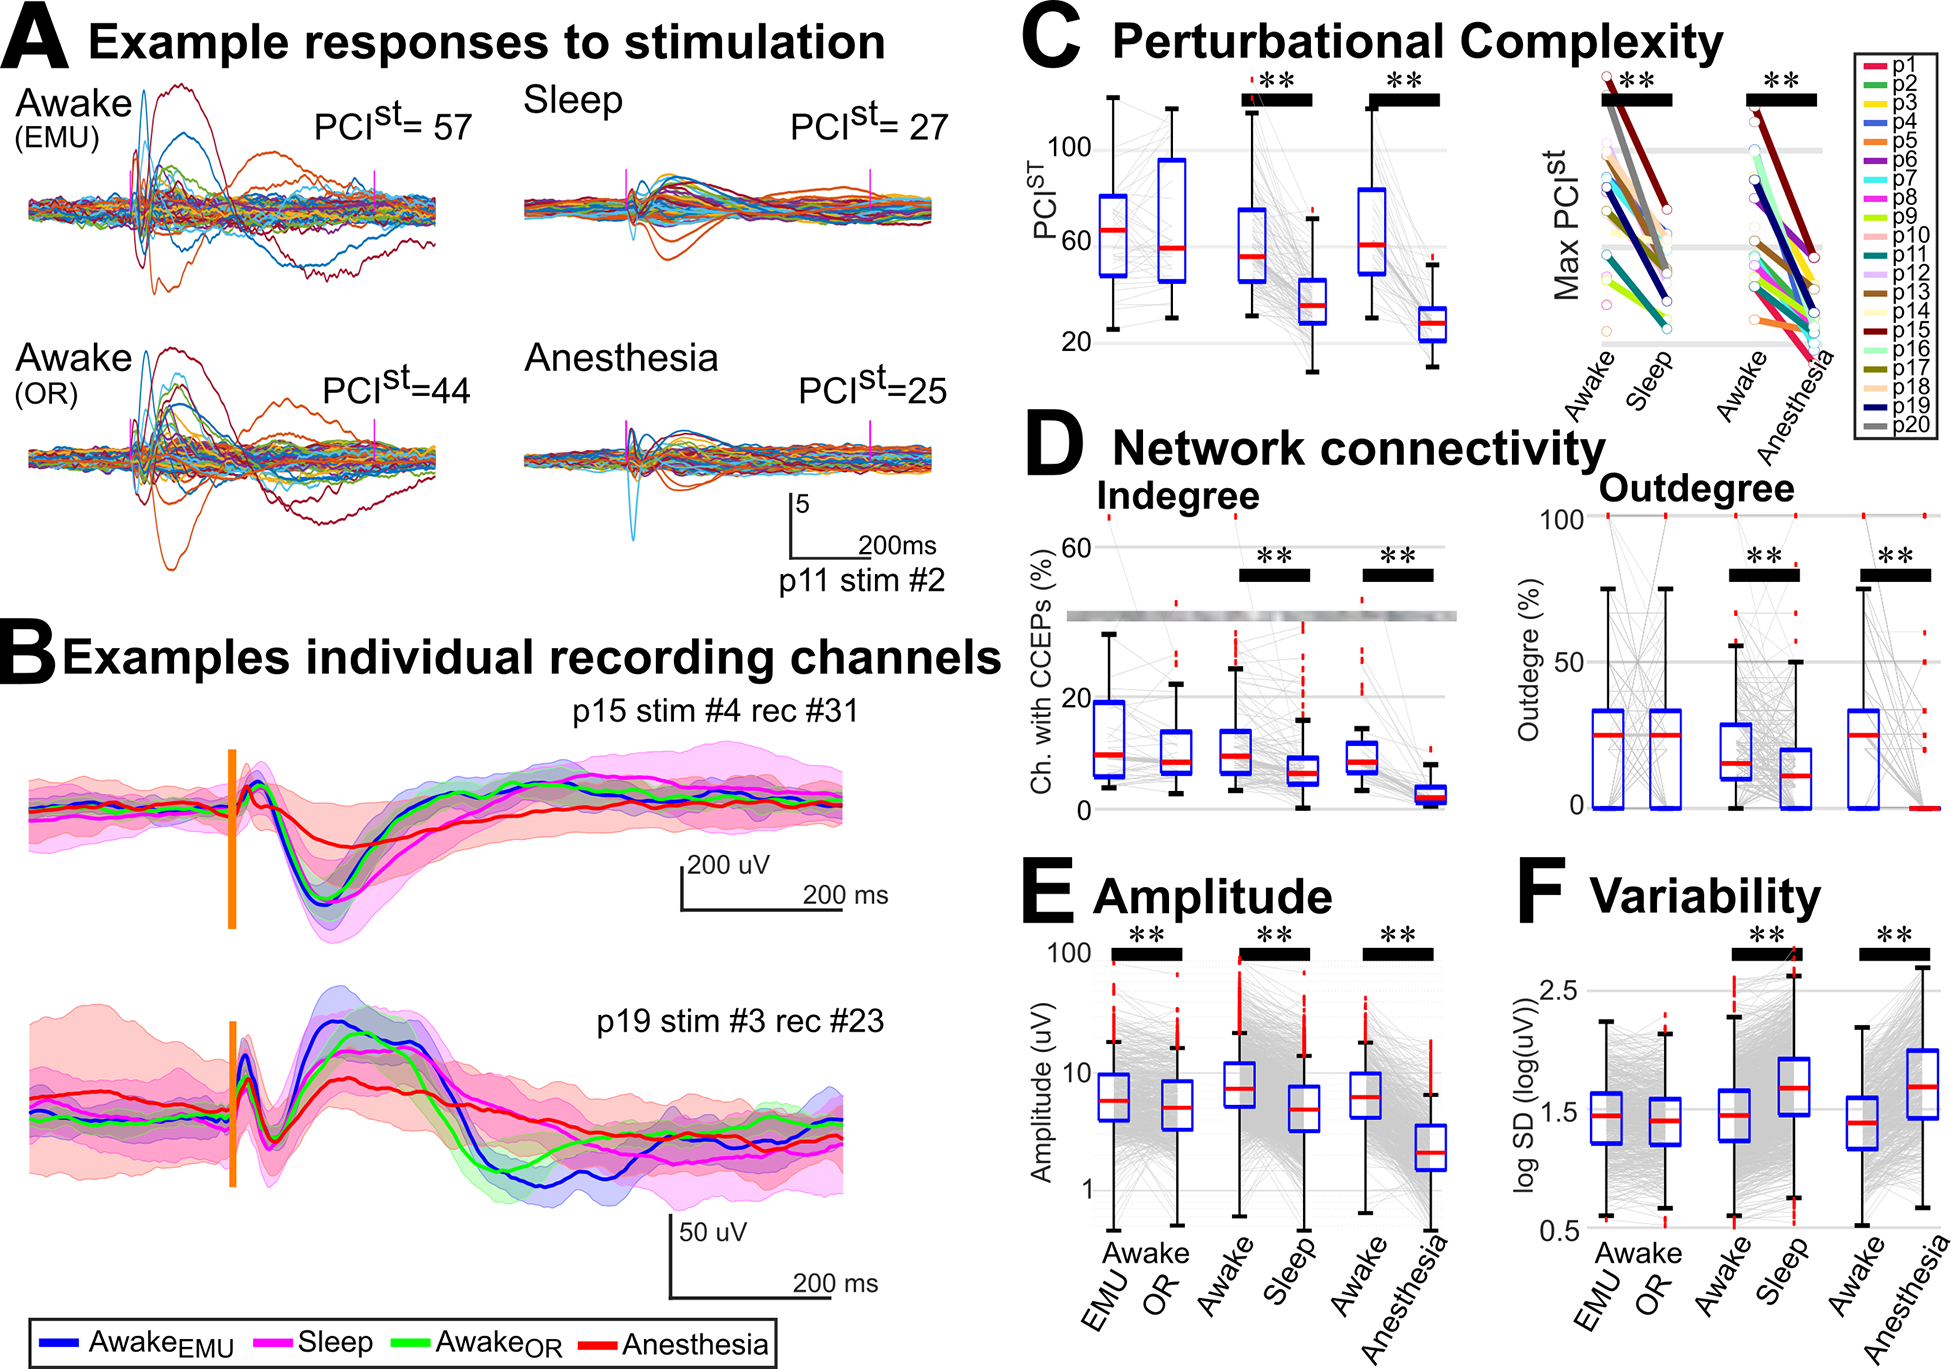
Figure 2. Complexity, CCEP Connectivity, CCEP features, and Variability during different states.

A) Representative example of z-scored averaged intracranial EEG following stimulation cortex (p11; stimulation in PFC). This illustrates reduced perturbational complexity (PCIst) during unconscious states (sleep & anesthesia). Colored lines: individual recording channels. B) Representative examples of variability across states in two recording channels (p15 & p19). Mean and standard deviation of the intracranial EEG during awake in the EMU (blue trace), sleep (magenta), awake in the OR (green), and anesthesia (red). Spread was large for anesthesia, corresponding to large inter-trial variability. Vertical line: stimulation time. C) Left: Complexity was reduced during sleep compared to awake (N=13, s=99) and during anesthesia compared to awake (N=14, s=36) in the same environment. Right: Maximum complexity was reduced for each participant during unconscious states. (D) CCEP indegree (left) and outdegree (right) connectivity were reduced during sleep (N = 13, s = 99, r = 860) and anesthesia compared with awake (N = 14, s = 36, r = 562). Grayed area indicates a cut in the scale. (E) The response amplitude was reduced during sleep (r = 1527) and anesthesia (r=573) compared to awake. Notably during anesthesia, the amplitude was reduced in almost all channels while during sleep, even though for most channels it was reduced (A and Fig. 1.C), in some it was similar (B) or even larger (Fig. S3) during sleep than awake. (F) Inter-stimulation variability increased during sleep (r = 1527) and anesthesia (r=573) compared to awake. C&D: Wilcoxon tests; E&F: permutation tests. ** indicates p<0.01. Gray lines: individual stimulation (C&D) or recording (E&F) channels. CCEP: cortico-cortical evoked potential; N: number of participants; s: number of stimulation channels; r: number of recording channels. See also Fig. S3 and Tables S2 & S3.
